Console Dashboard
Advertiser Dashboard
The Advertiser Dashboard provides a detailed view of advertising performance for a selected advertiser. It includes real-time insights, breakdowns across channels, and key performance metrics—designed to help marketers monitor, analyze, and act.
Overview
The dashboard consists of the following key sections:
- Summary Metrics
- Performance Trend Chart
- Channel-Level Tabs
- Campaign Performance Table
- Global Date Range Selector
- Breakdown Hover Details
All sections are dynamically updated based on the selected date range and filters.
1. Summary Metrics
At the top of the dashboard, summary tiles give a snapshot of overall performance.
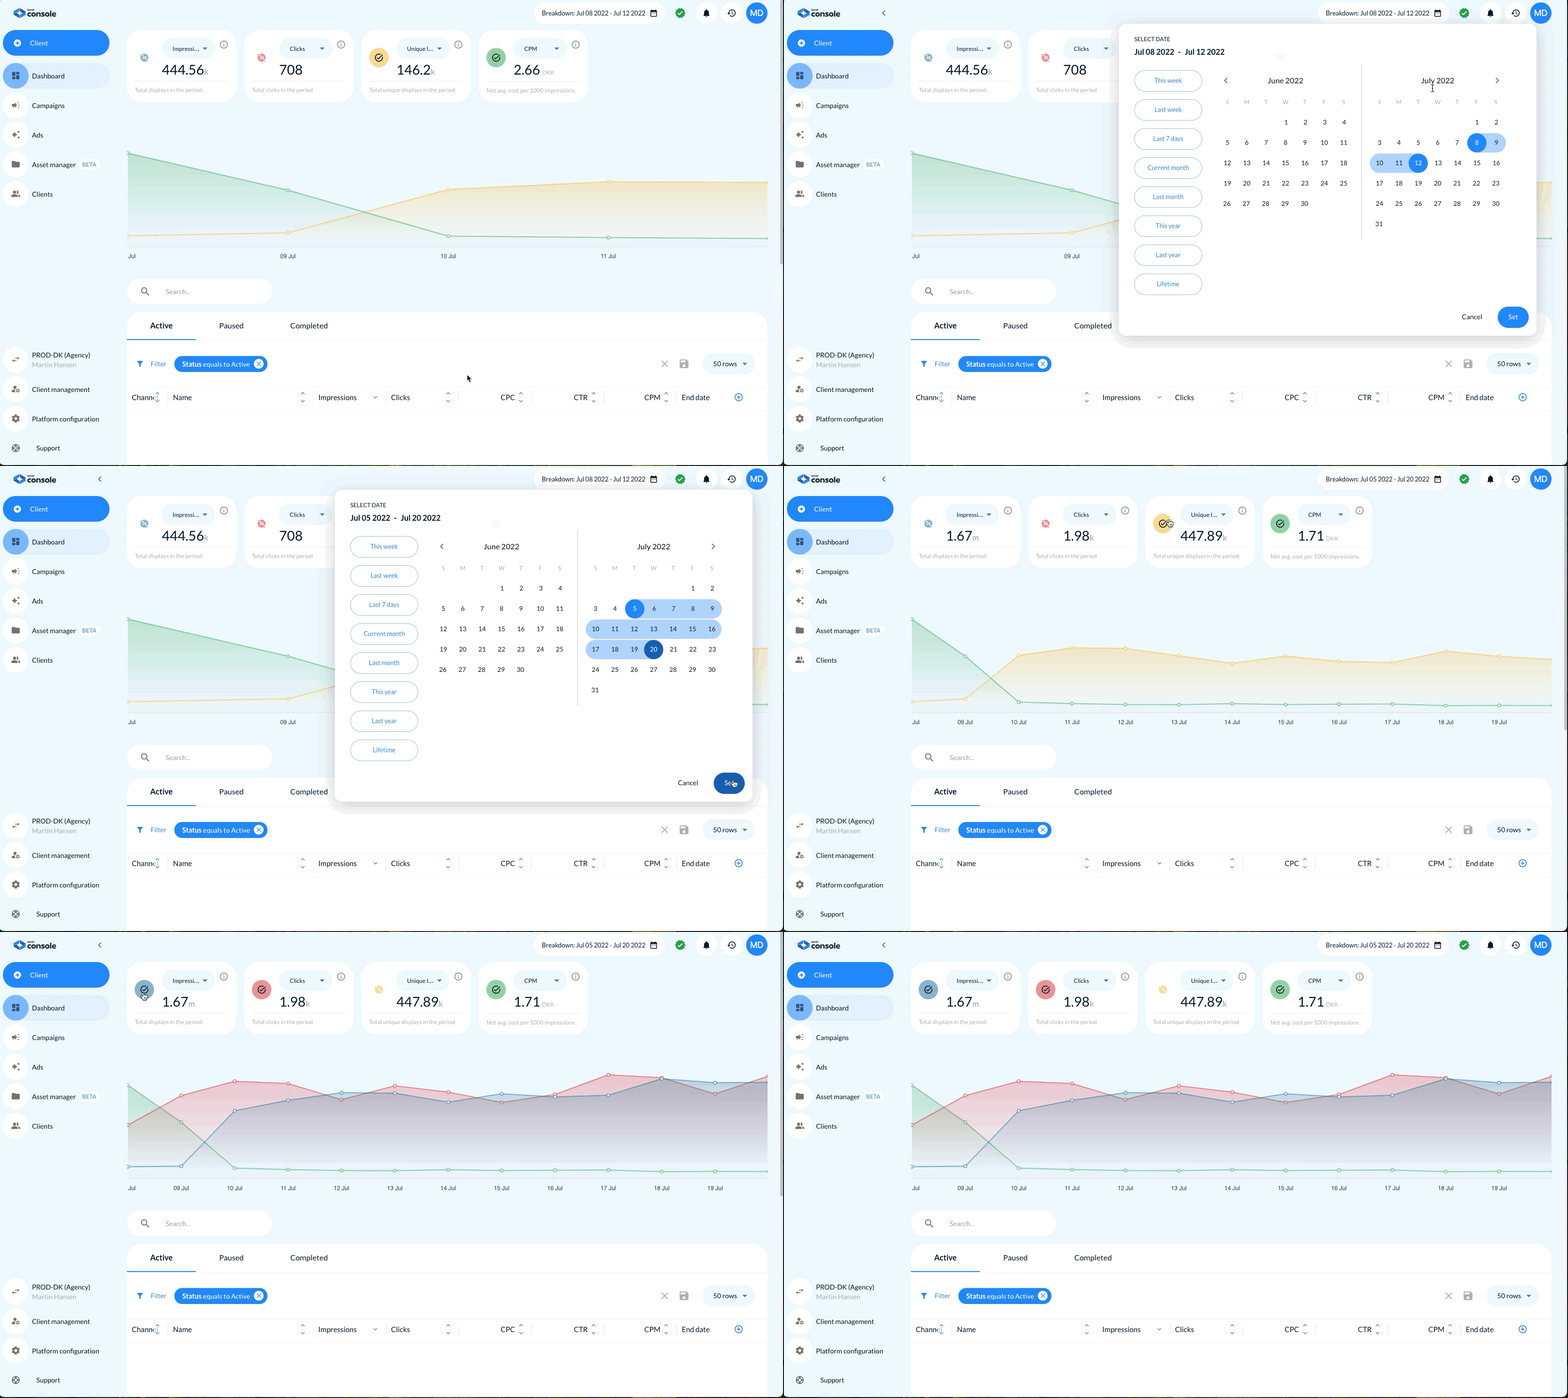
Tile Features:
- Metric title
- Numeric value
- Tooltip (info icon) for explanation
- Dropdowns for switching metrics (where supported)
Available Metrics:
- Impressions – Total ad displays
- Unique Impressions – Count of unique users who saw an ad
- Clicks – Total ad clicks
- Spent – Total spend in the period
- CPM – Cost per 1,000 impressions
- CPC – Cost per click
- CTR – Click-through rate
- eCPC – Effective cost per click (across mixed buying models)
- eCPM – Effective cost per 1,000 impressions
- Viewability – % of impressions considered viewable
- Sales – Total sales driven by the campaigns
- Orders – Total number of customer orders
- CPA (Cost per Acquisition) – Spend divided by number of conversions/orders
- ROAS (Return on Ad Spend) – Sales divided by spend
- Conversion Rate – Orders divided by clicks
Tiles update instantly based on the selected advertiser and date range. (All of above can be configured and hidden)
2. Performance Trend Chart
Below the summary tiles is a line graph visualizing performance trends.
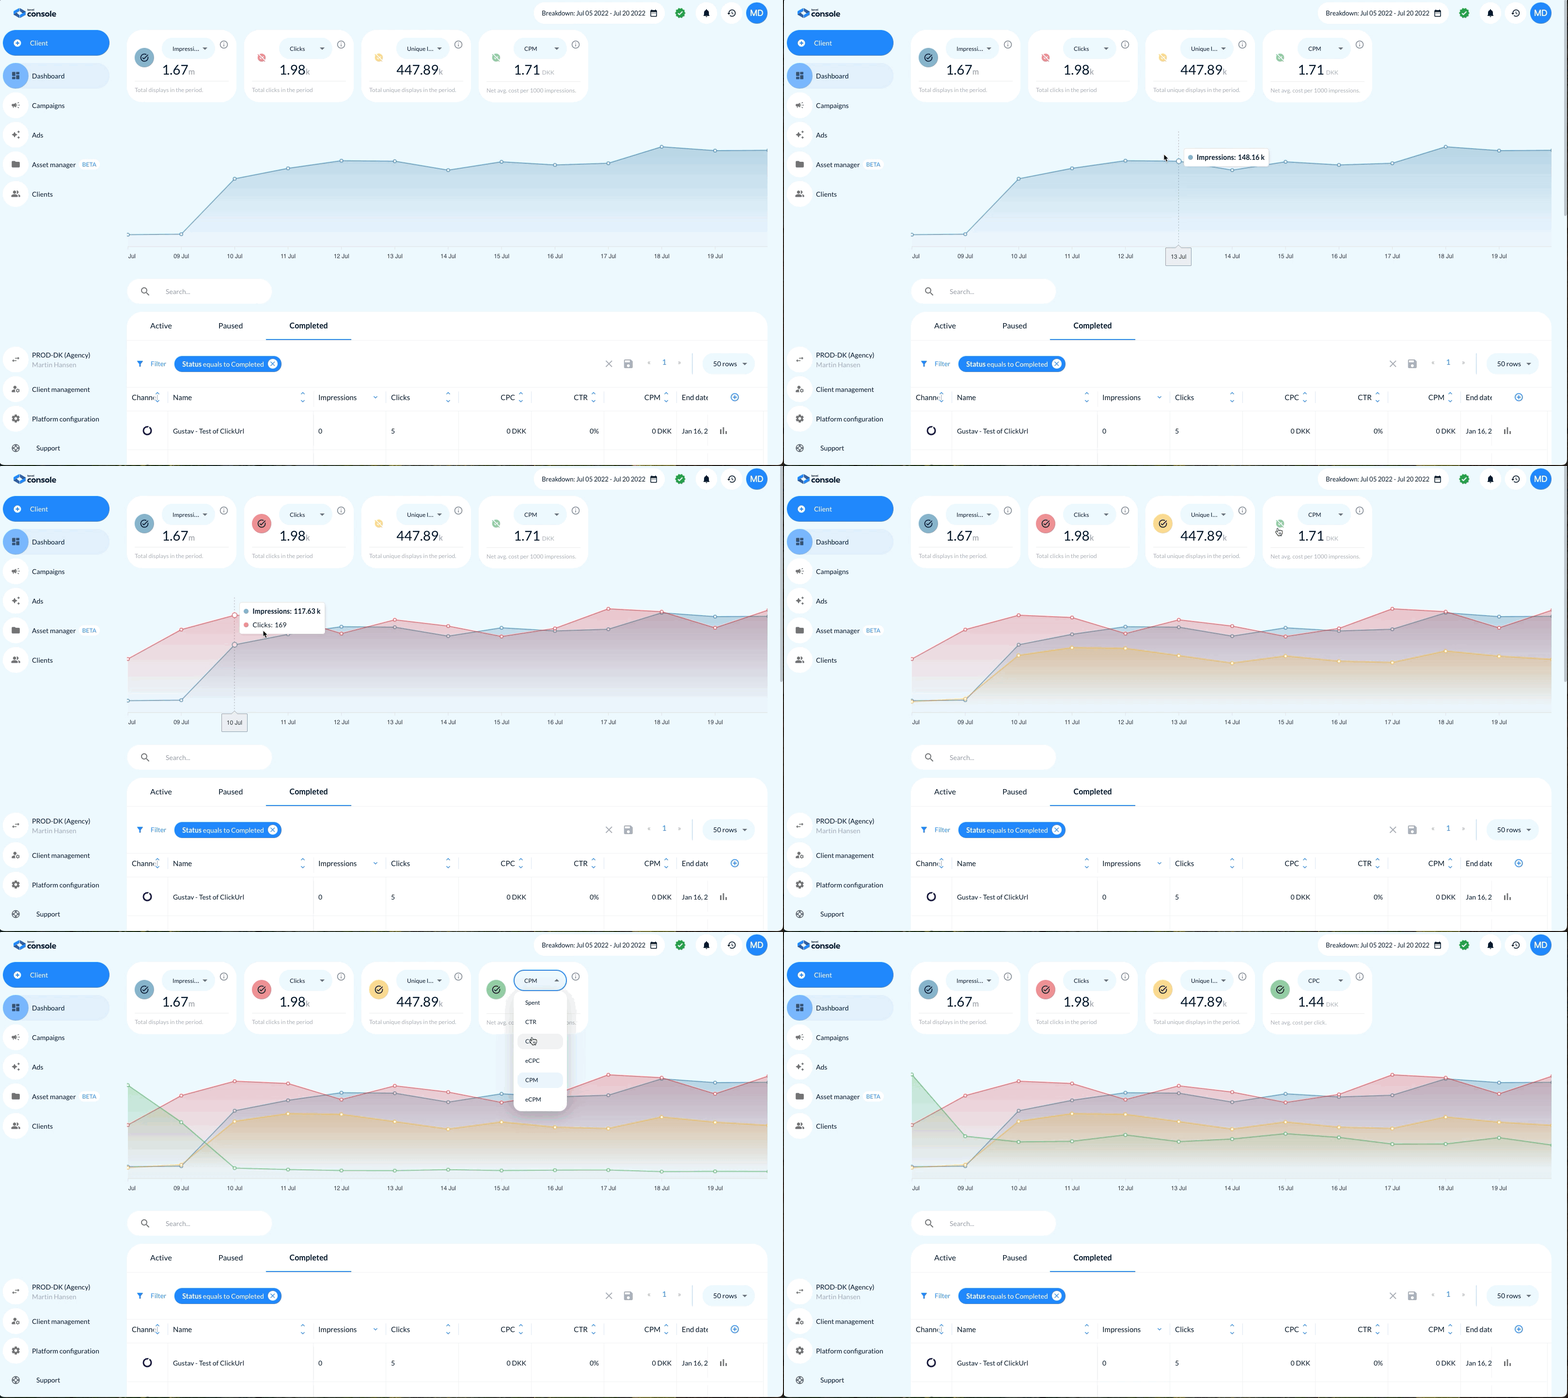
Features:
- X-Axis: Time (by day)
- Y-Axis: Metric value
- Selectable Metrics: Overlay up to four metrics at once
- Hover Details: See exact values per metric per day
- Smooth transitions between metrics
- Multi-metric comparison: Analyze relationships (e.g. CTR vs. CPC)
This chart enables fast visual diagnostics of spikes, dips, and anomalies.
3. Channel-Level Tabs
Further down, the dashboard includes segmented breakdowns per media channel. This view allows advertisers to isolate results by platform.
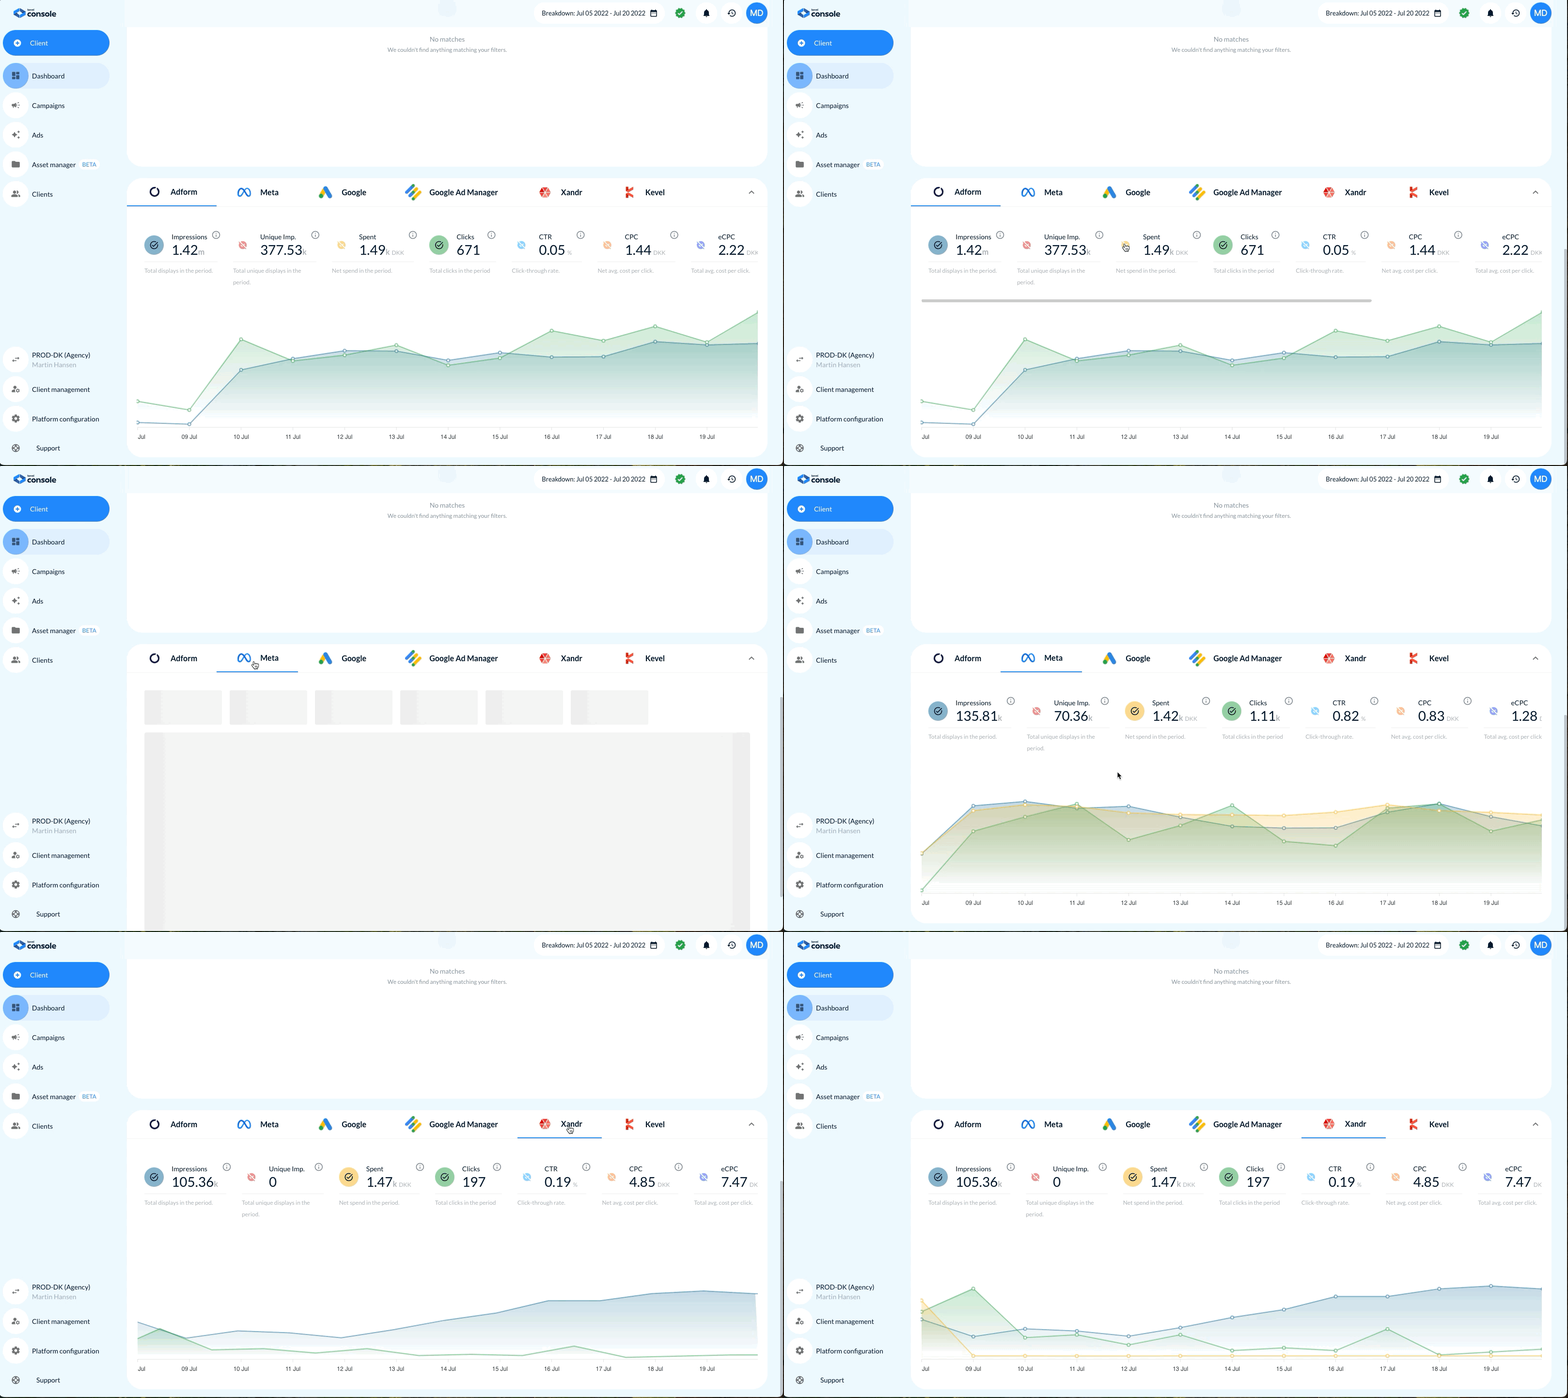
Available Channels:
- Meta
- Google Ad Manager
- Adform
- Xandr (to be depricated: Microsoft Ads)
- Kevel
Each channel tab contains:
- Metric tiles specific to that channel
- Mini trend chart
- Metrics include: Impressions, Unique Impressions, Clicks, Spent, CTR, CPC, eCPC, CPA, ROAS
This makes cross-channel analysis intuitive and actionable.
4. Campaign Performance Table
A campaign summary table appears below the visualizations.
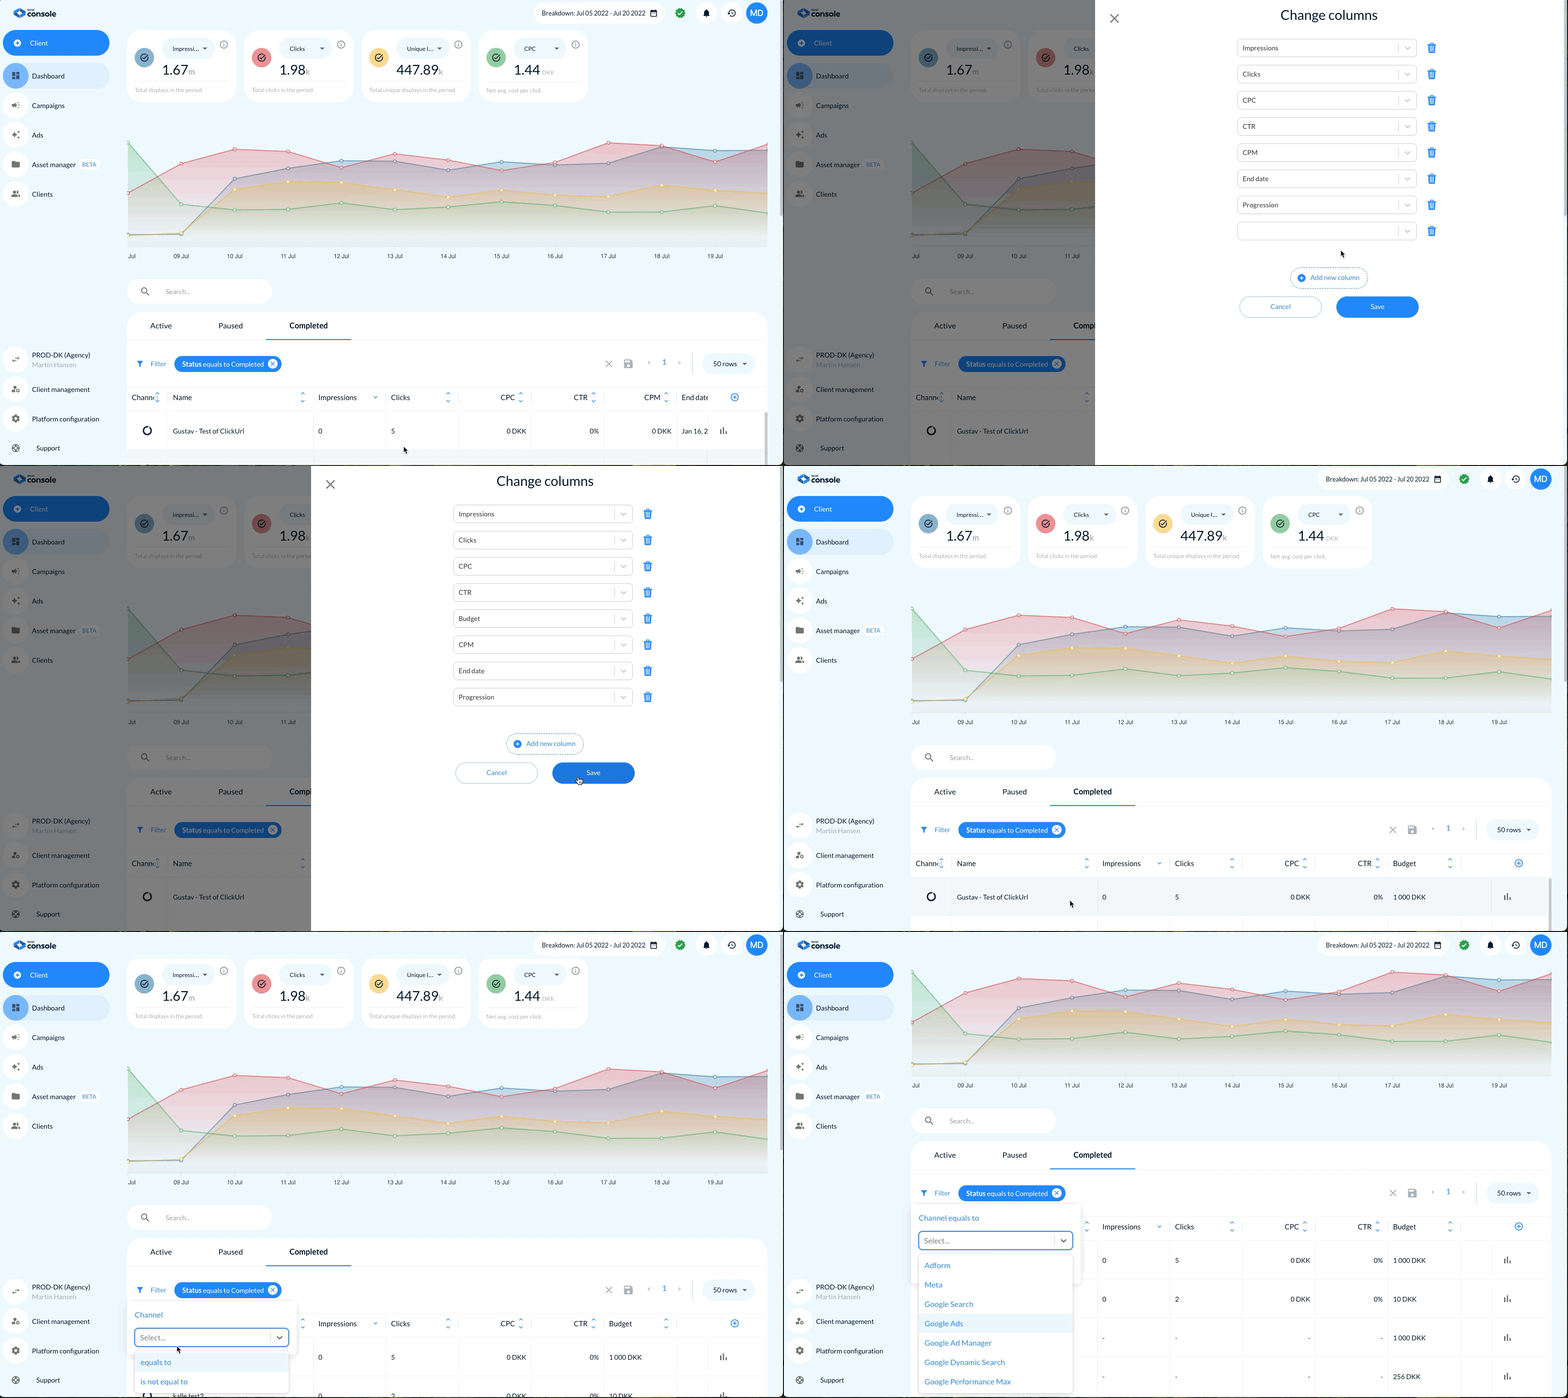
Key Columns:
- Status toggle (on/off)
- Campaign name
- Channel (e.g., Meta, Display)
- Impressions
- Clicks
- CPC
- CTR
- CPM
- End Date
- Budget Progression (visual bar)
Features:
- Status Filters: Tabs for Active, Paused, and Completed campaigns
- Search bar: Filter by campaign name
- Advanced filters: Status, channel, date, etc.
- Sorting: Click any column to sort ascending/descending
- Pagination: Adjustable rows per page
5. Date Range Selector
A global date picker controls all metrics and charts across the dashboard.
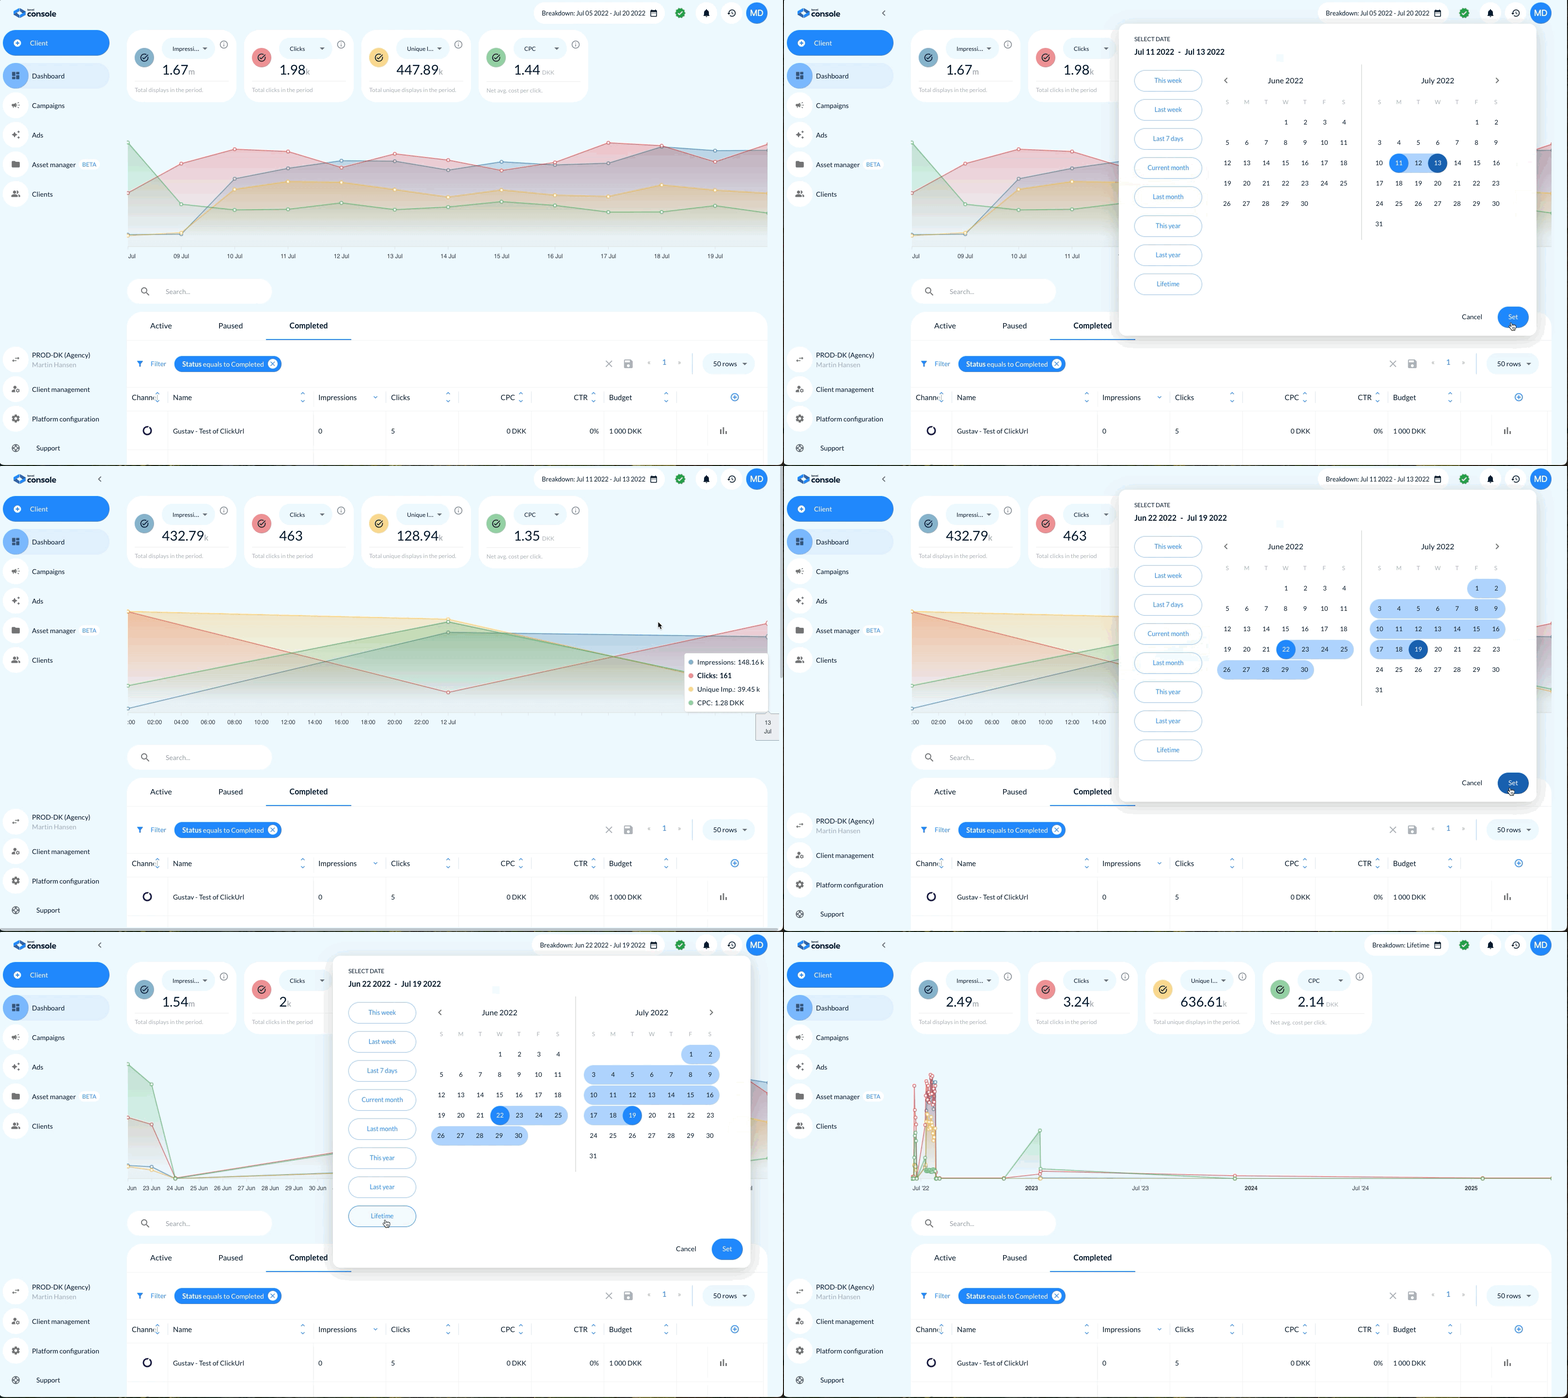
Preset Options:
- Today
- This week
- Last 7 days
- Last 30 days
- This month
- Last month
- This year
- Last year
- Lifetime
6. Breakdown Hover Details
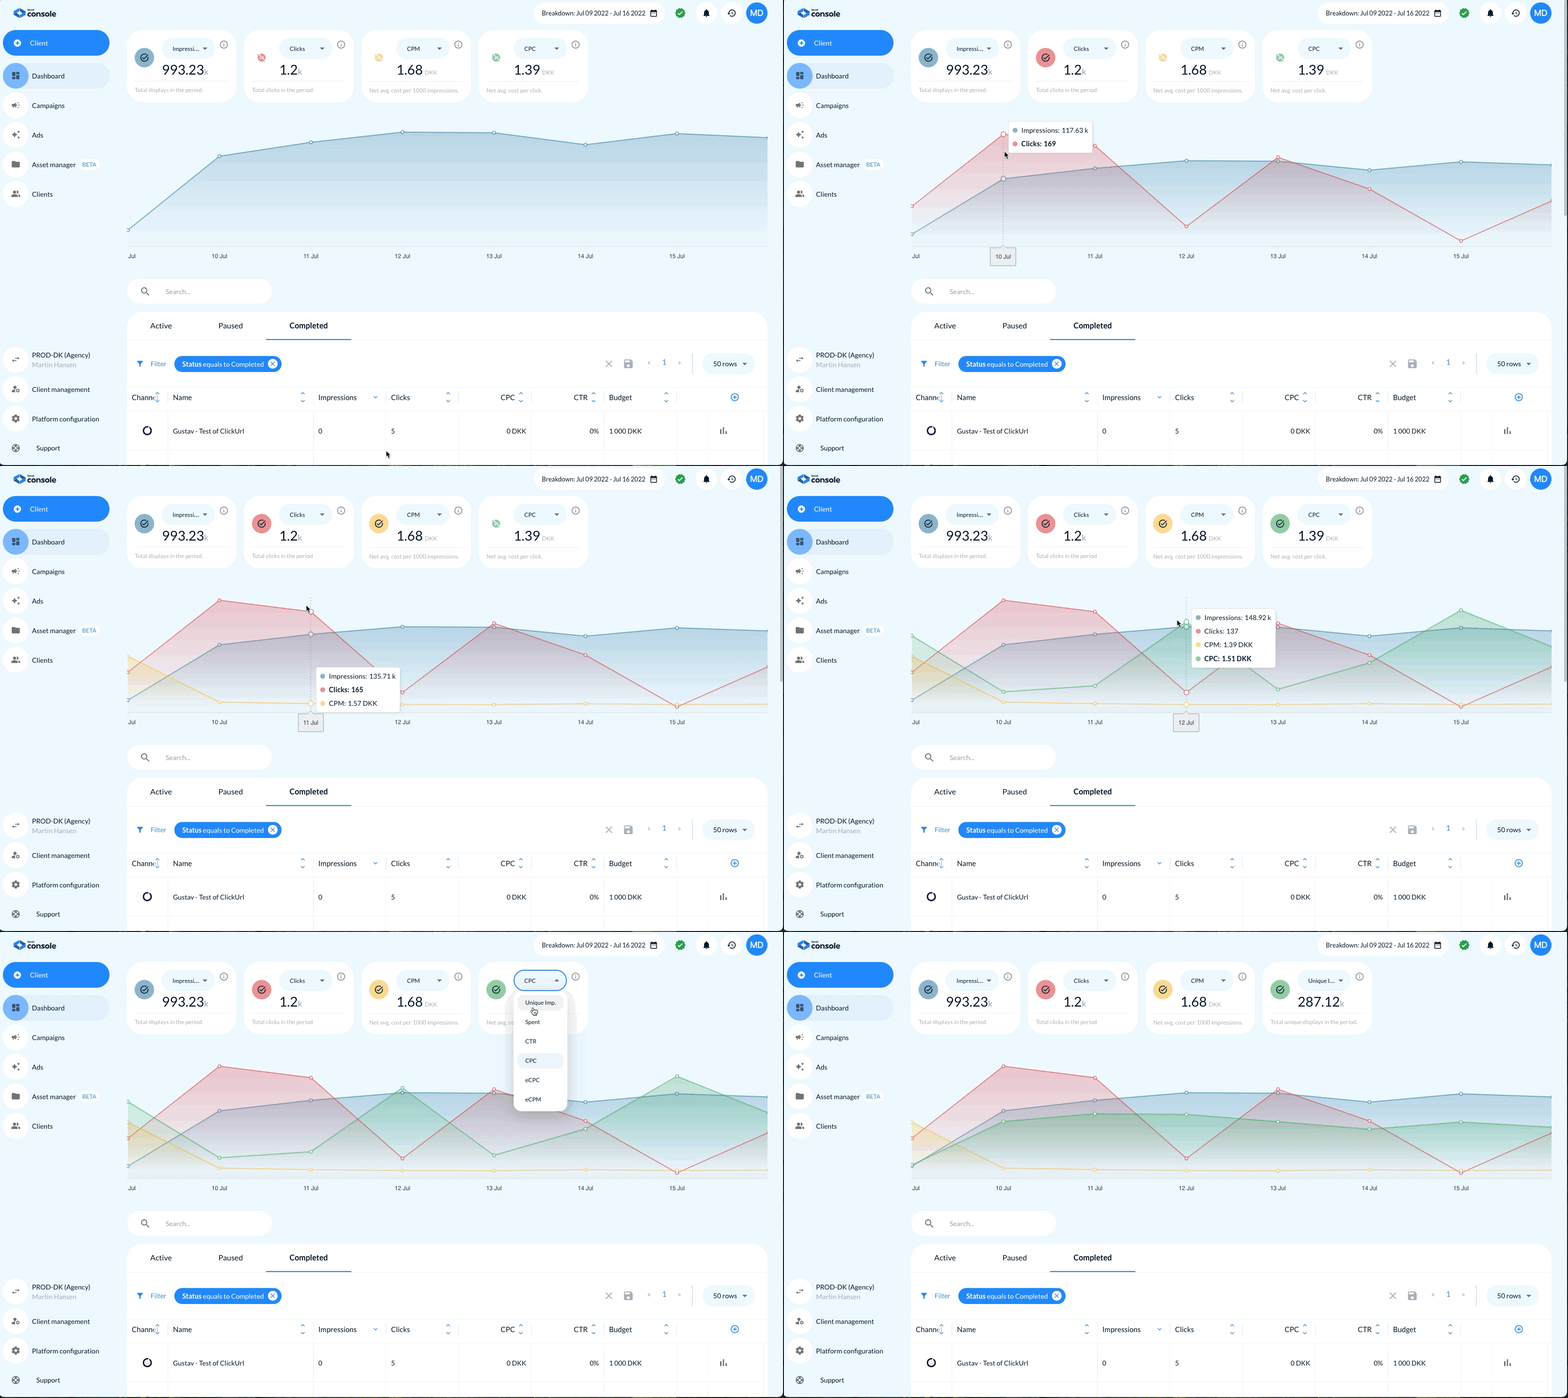
Hovering over the trend chart reveals:
- Impressions
- Clicks
- CPM
- CTR
- Unique Impressions
- Sales, Orders, CPA, ROAS, and Conversion Rate (where supported)
- Channel-specific breakdowns (if a tab is selected)
Tooltips display daily values for precise day-by-day comparison.
Summary
The Advertiser Dashboard in Console offers full-funnel visibility - from top-of-funnel impressions to bottom-line return on spend. It supports channel-specific analysis, performance monitoring, and tactical planning.
It’s built for marketers who want clarity, not clutter.
Updated 3 months ago
