
Explore your data in Ad Program Insights
Media owners can pick their own measures and dimensions in the performance explorer, or ask the AI assistant a question in plain language.
The performance explorer and the AI assistant go beyond the dashboard's fixed charts. In the explorer you pick the measures and dimensions yourself. In the assistant you ask a question in plain language. Business managers use them when the dashboard shows a movement and they want to know where it comes from. This page is part of Ad Program Insights and covers two areas: the Ad Program performance explorer and the AI assistant. The dashboard, with its fixed charts, is on the parent page.
How it works
Both are part of Ad Program Insights and show the network you have open. Open the explorer from the breadcrumb at the top of the dashboard, Home / Ad Program Insights, and open the assistant with AI at the top right. The explorer uses the same data as the dashboard, so a figure should match the dashboard for the same time range and filters. The assistant is not limited to the dashboard's data, so check its figures against the dashboard.
The performance explorer
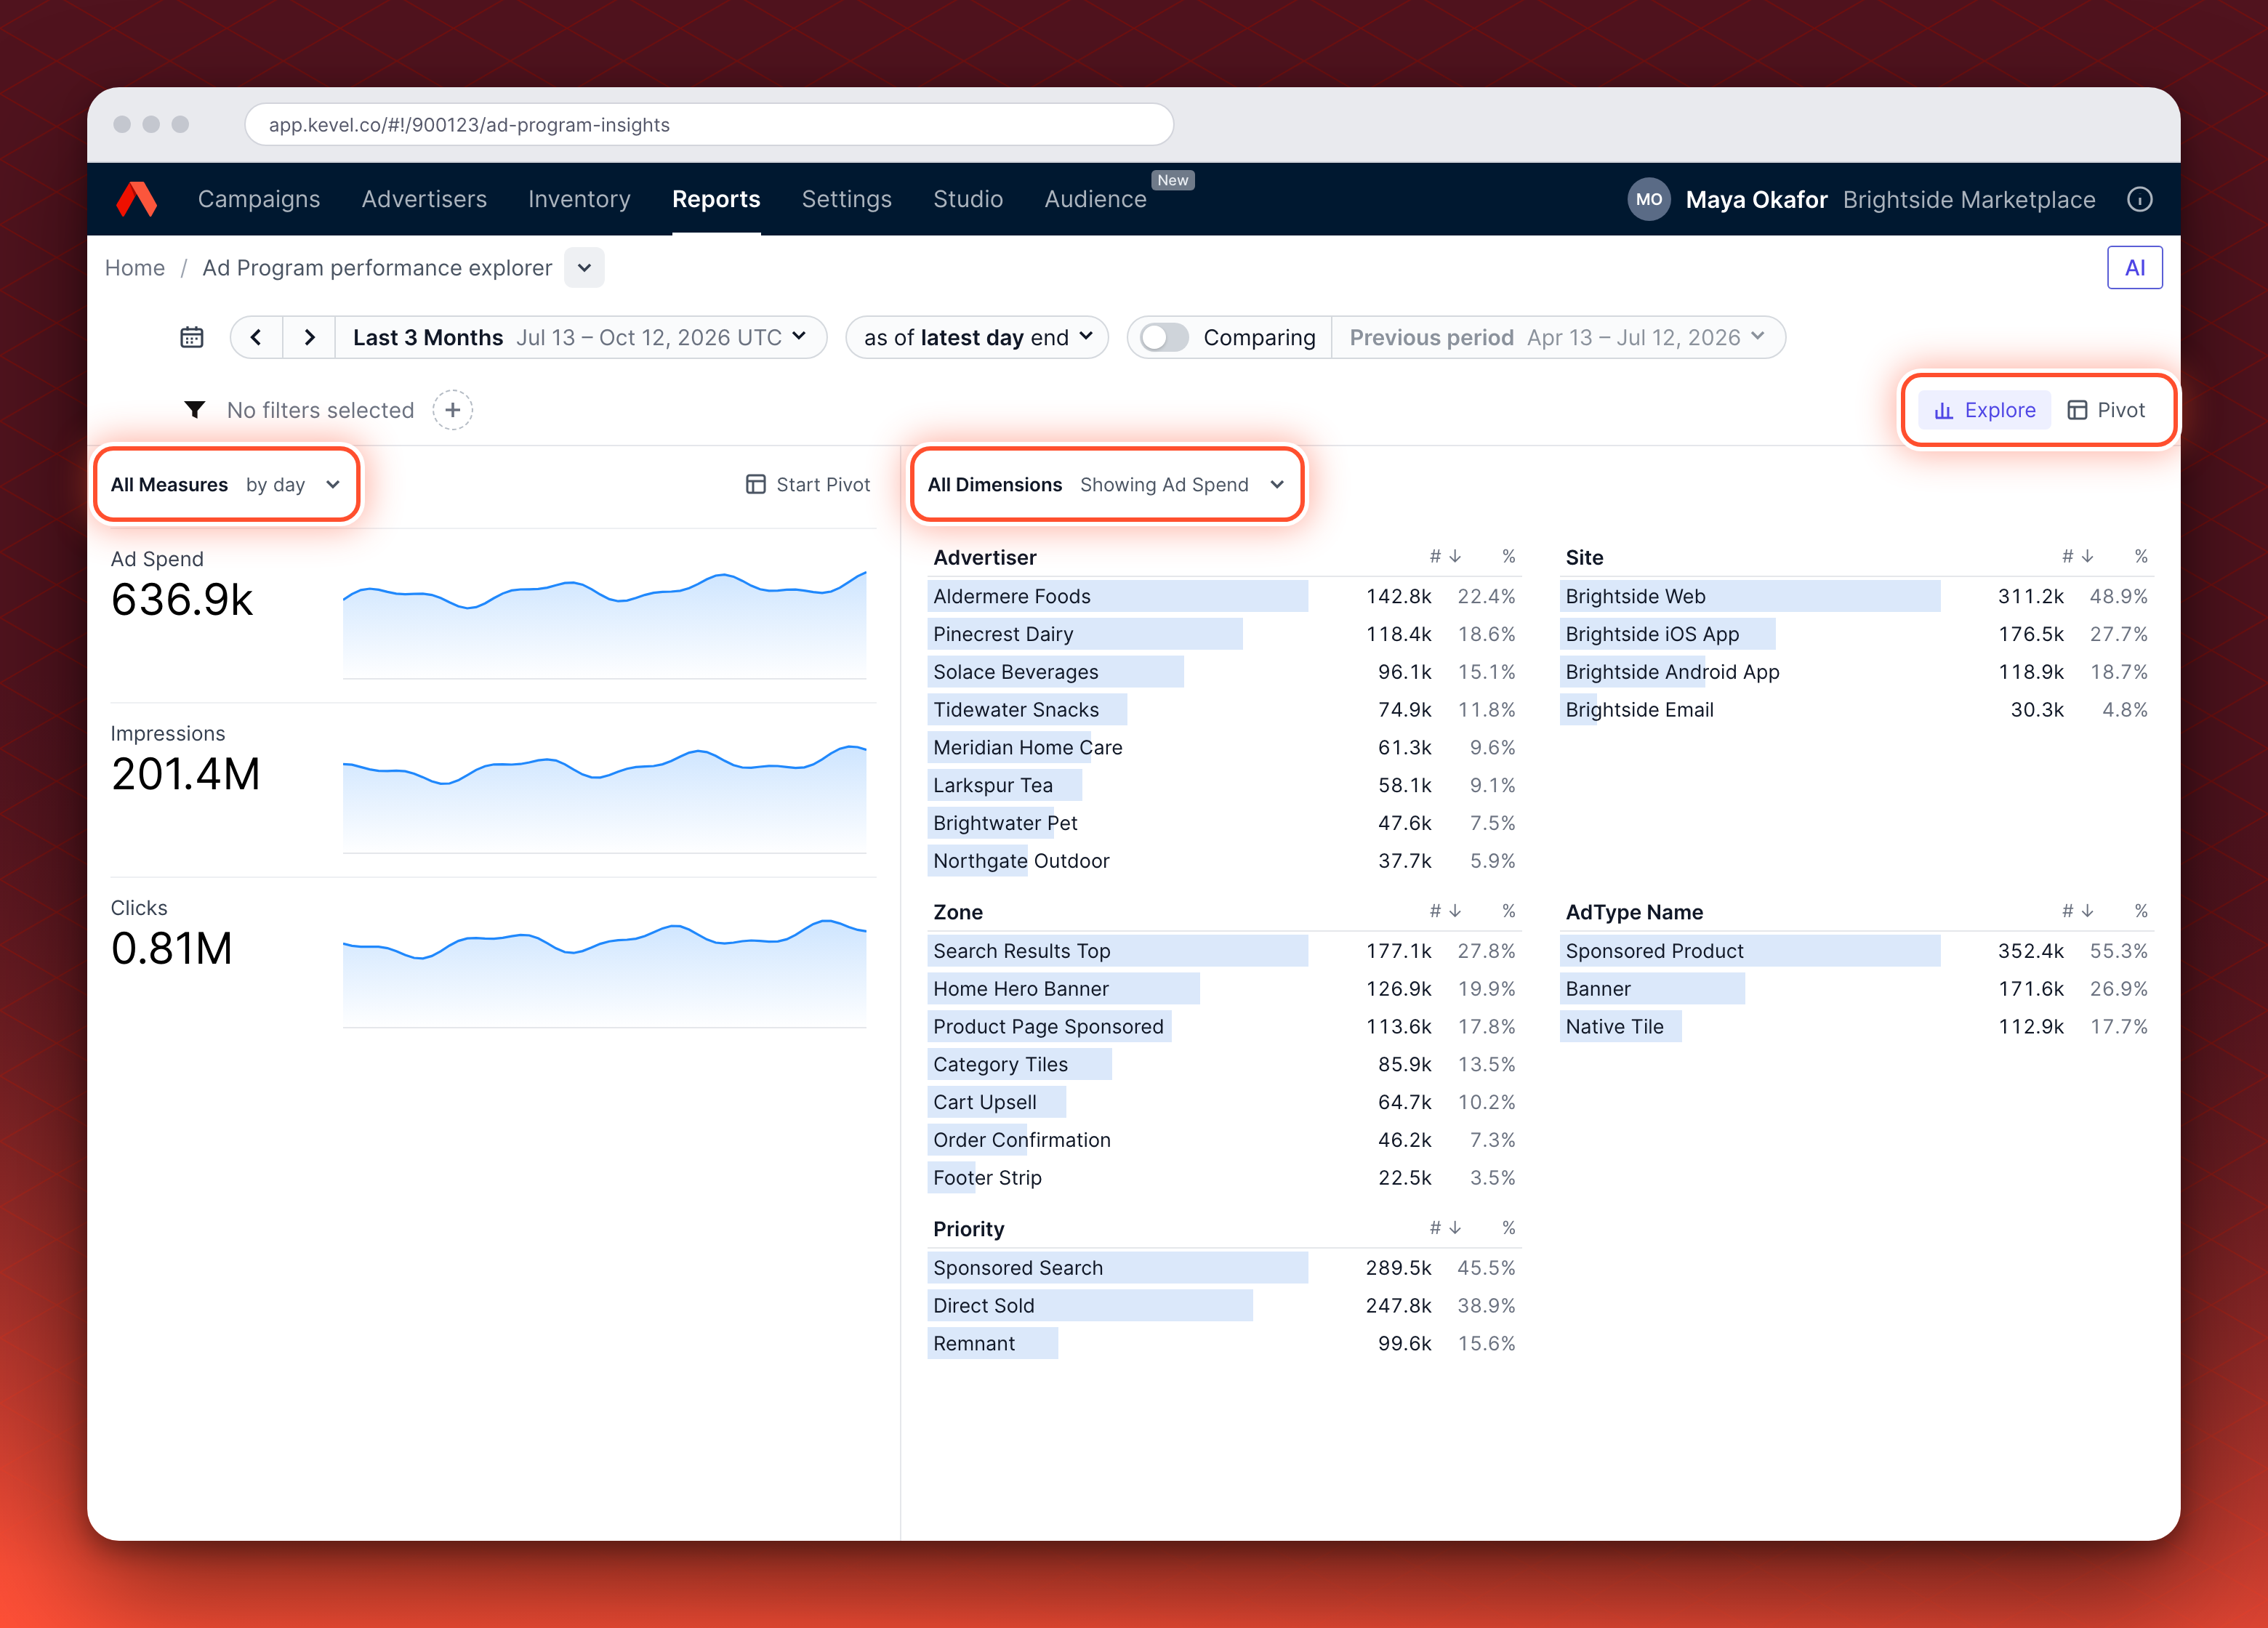
The Ad Program performance explorer opens with Ad Spend, Impressions and Clicks, broken down by Advertiser, Site, Zone, AdType Name and Priority, over the last three months of data. Every Ad Program measure is available, including # advertisers and Average order value, which the dashboard does not show.
The explorer also offers Zone Names and AdType Names in its list of dimensions. Their descriptions say to use them when you filter ad opportunities.
What the explorer shows
- The left pane charts each measure over time. Select All Measures to choose which.
- The right pane ranks each dimension for one measure. Select All Dimensions to choose the dimensions and the measure. In each list, # is the value and % is the share.
- Start Pivot opens the table view. In Pivot you can switch between a flat table and nested rows, collapse all rows, and export.
Starting points
| Question | Measures | Group by | What to look for |
|---|---|---|---|
| Where do requests go unfilled? | Ad Opportunities, Fill Rate, Unfilled Impressions | Zone Names | Zones with many opportunities and a low fill rate. These measures start on 27 March 2026. |
| Which Sites earn the most? | Ad Spend, CPM | Site | How spend and CPM differ from Site to Site. |
| Who buys the most, and how concentrated is it? | Ad Spend, # advertisers | Advertiser | The share the largest Advertiser takes, and whether # advertisers changes across ranges. |
| Which placements perform? | Impressions, Clicks, CTR, ROAS | Zone, then AdType Name | Where CTR and ROAS are high or low next to similar spend. |
| Is a Priority skewing the figures? | Ad Spend, Impressions | Priority | A Priority you use for house ads. Exclude it before you read inventory figures. |
Each list in the Explore view ranks the values of one dimension. To group by two, such as Zone then AdType Name, switch to Pivot at the top right and select both dimensions, then the measures, from the lists at the left. Use Export there to export the table.
The AI assistant
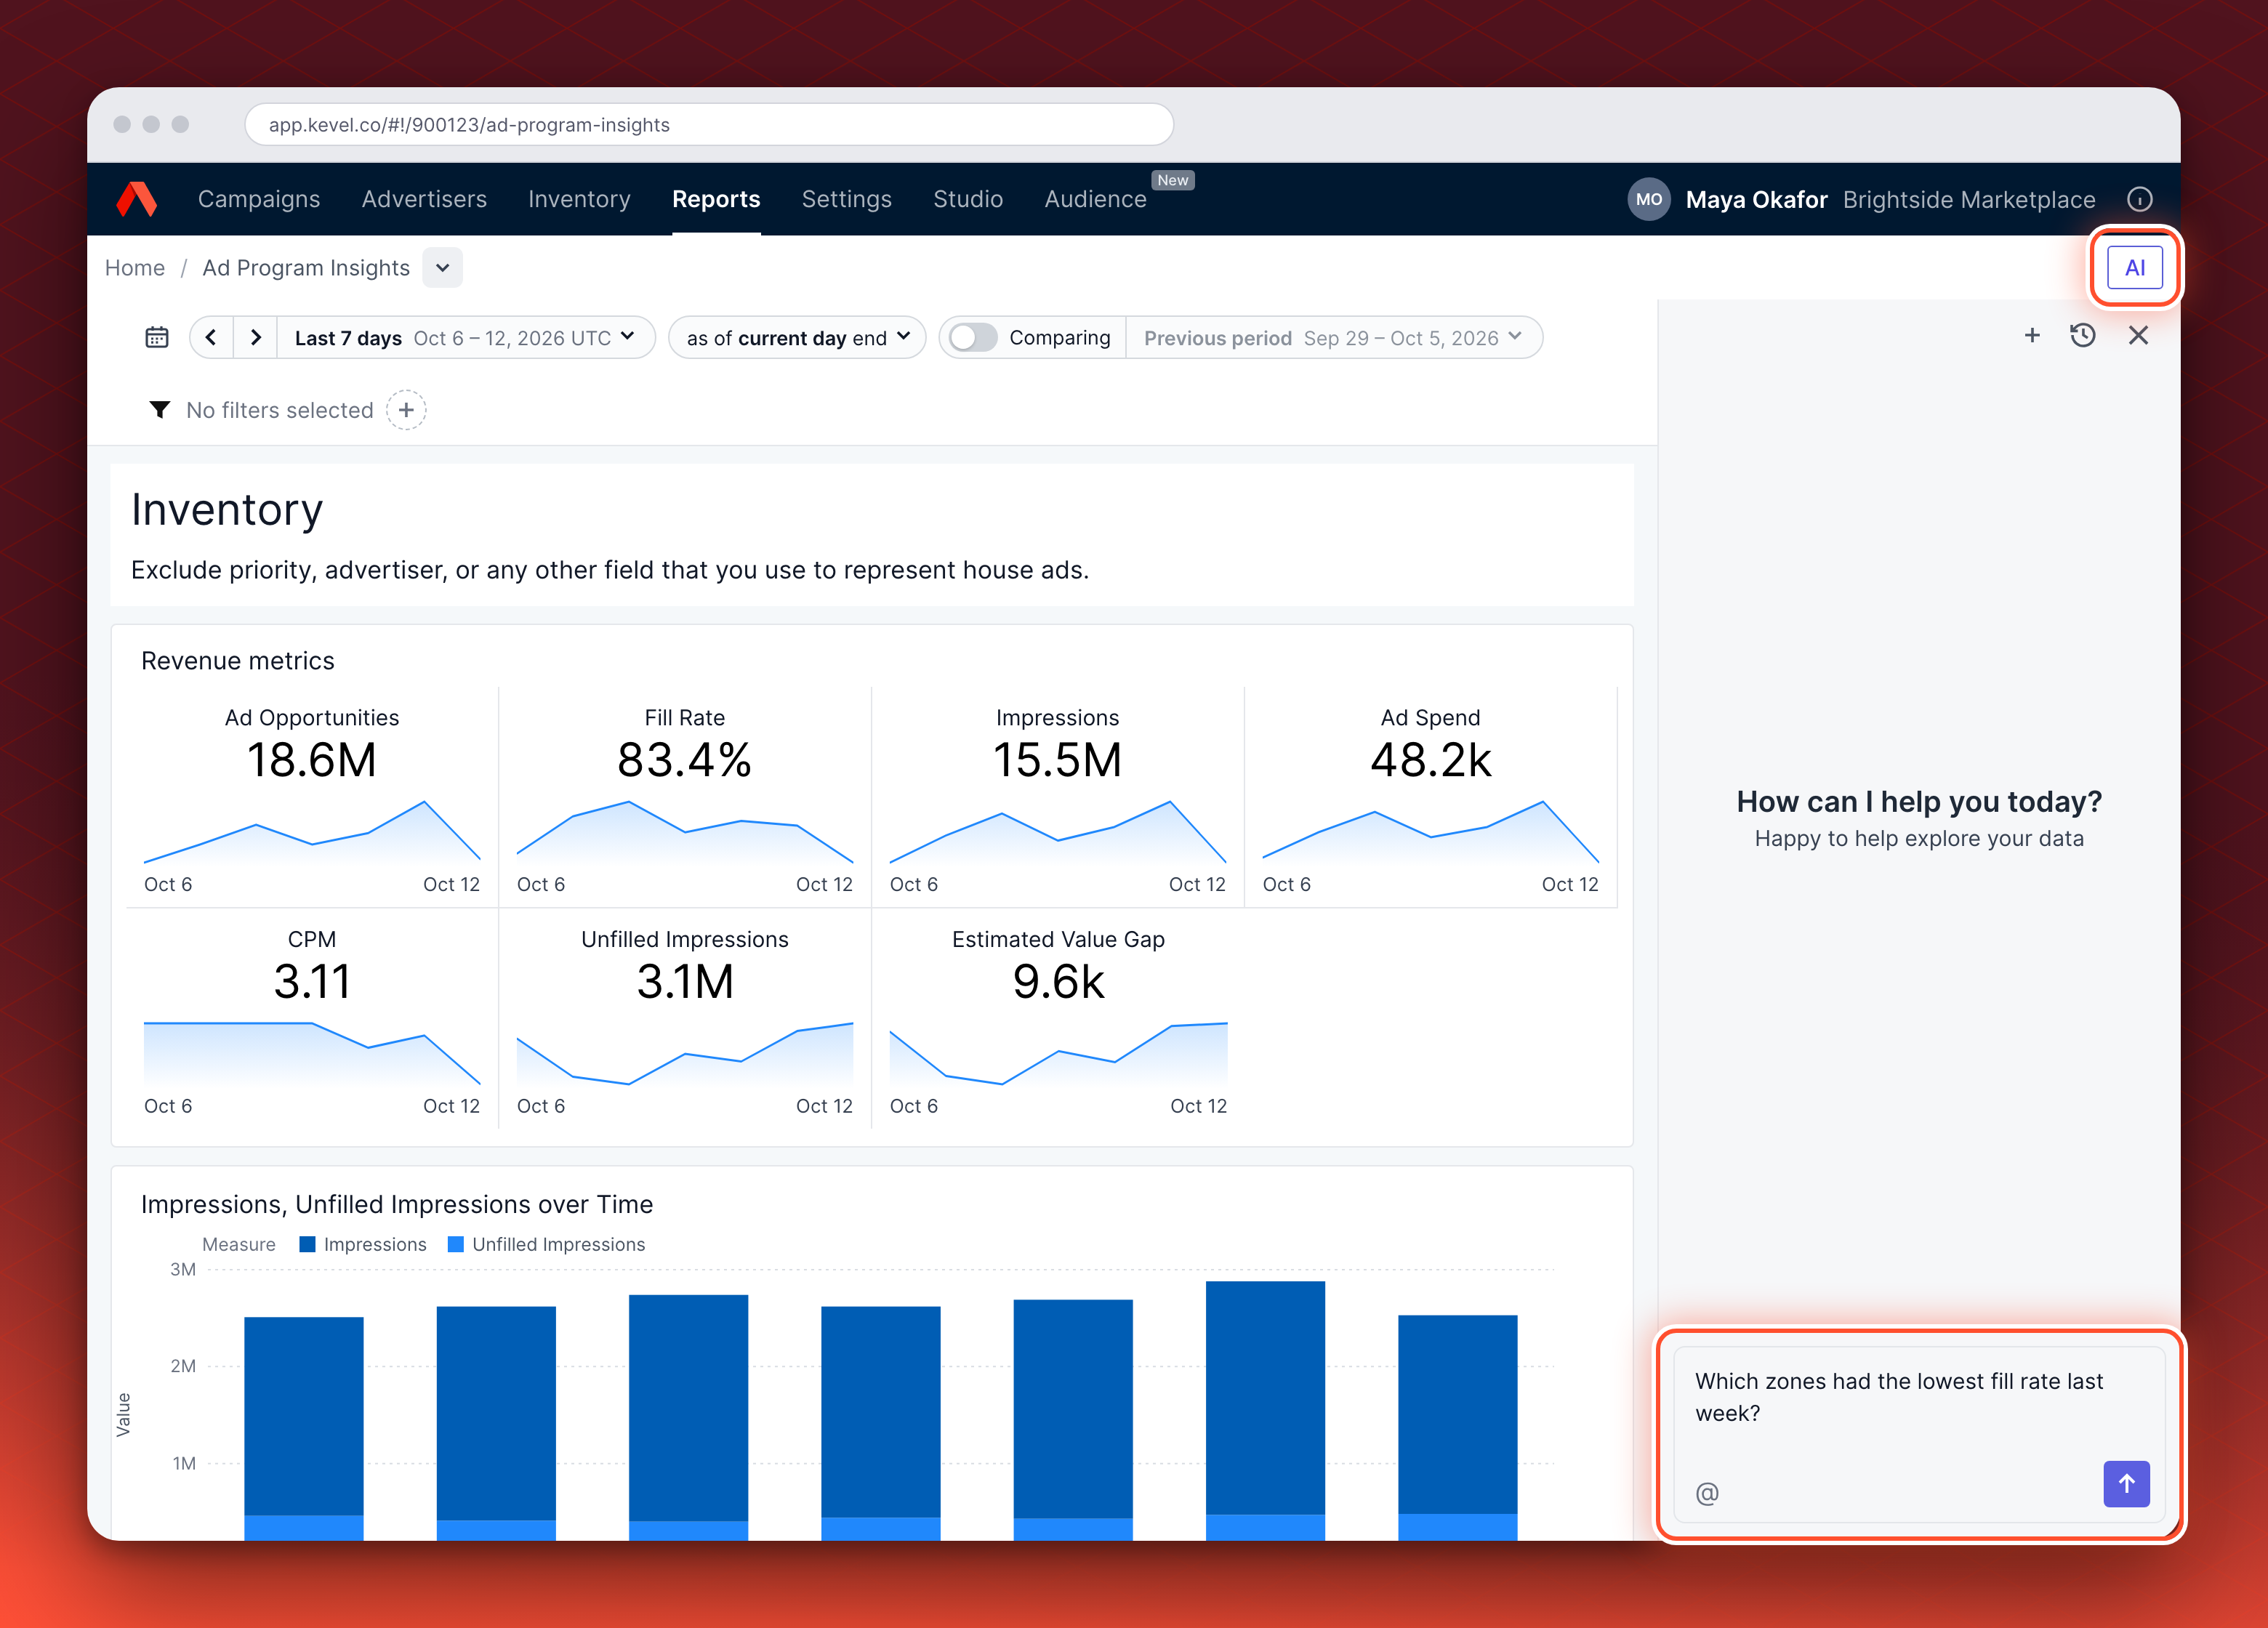
Select AI at the top right to open the pane, then type a question, or press @ to insert a metric, dimension or measure. In the pane, + starts a new conversation and the clock icon opens earlier ones. If you ask for a chart, the assistant draws it in the pane.
Prompts to start with
These are starting points, not scripts. Change the measure, the period or the breakdown to fit your question.
Inventory
- "Which Zones had the lowest fill rate last month, and how many unfilled impressions did each have?"
- "How did fill rate change week by week since 27 March 2026?"
- "Compare unfilled impressions by Zone this month with last month."
Revenue
- "Show ad spend by Site for the last 30 days and the change from the previous 30 days."
- "What share of ad spend came from my five largest Advertisers last quarter?"
- "How many Advertisers had ad spend in each of the last six months?"
Performance
- "Which Zones have the highest ROAS over the last 30 days?"
- "Compare CTR and CPC by AdType for last month."
Leadership summary
- "Summarize ad spend, CPM and fill rate for last quarter against the quarter before, and call out the biggest changes."
Ask the assistant to state the time range and filters it used, and check the answer against the dashboard.
It is built for program-level questions about revenue sustainability, inventory use and the mix of advertisers. It is not intended for user-level analysis, creative testing, real-time optimization or attribution experiments. For Flight-level delivery, use Campaign health check up. For other breakdowns, use custom reports.
Measures and dimensions
These are the measures in the explorer.
| Measure | What it means |
|---|---|
| Ad Spend | The money advertisers spend with you, which is your ad revenue. |
| Impressions | The number of times an ad was shown. |
| Clicks | The number of ad clicks. |
| CTR | The share of impressions that got a click. |
| CPM | The cost of one thousand impressions. |
| CPC | The average cost of a click. |
| Purchase | Purchases attributed to advertising, also called conversions. |
| Conversion value | The value of those purchases. |
| ROAS | Conversion value for each unit of ad spend, shown as a percentage. |
| Average order value | The average spend for each conversion. |
| Clicks to conversions rate | Purchases as a share of clicks. |
| Impressions to conversions rate | Purchases as a share of impressions, including purchases without a click. |
| # advertisers | The number of different Advertisers in the range. |
| Ad Opportunities | Placements where an ad could have served, including ones left unfilled. Available from 27 March 2026. |
| Fill Rate | The share of ad opportunities that served an impression. Available from 27 March 2026. |
| Unfilled Impressions | Ad opportunities that did not serve an impression. Available from 27 March 2026. |
| Estimated Value Gap | The revenue missed when ad opportunities go unfilled. Available from 27 March 2026. |
Ad Spend, Clicks and Conversion value count only events with a valid user agent that are not duplicate impressions. Impressions counts every impression.
These are the dimensions.
| Dimension | What it is |
|---|---|
| Advertiser, Site, Zone, AdType Name and Priority | The latest name of each resource. A row reads <unknown> when no name is on file, and Site, Zone, AdType Name and Priority show flat-rate revenue as <flat_rate>. |
| Zone Names and AdType Names | Zone Names is the same name as Zone. AdType Names lists every AdType name on the ad opportunity, sorted and separated by commas. Use both when you filter ad opportunities, not impressions. |
Change the range, switch views and ask
| Option | Where | What it does |
|---|---|---|
| Time range and filters | The controls at the top of the explorer | The explorer opens on the last three months of data. Narrow it to an Advertiser, Site, Zone, AdType Name or Priority. |
| Explore or Pivot | The switch at the top right of the explorer | Explore ranks values for each dimension. Pivot lays the measures out as a table you can export. |
| Your question | The message box in the assistant | The more specific the question, the more useful the answer. Name the measure, the period and the breakdown, and ask the assistant to state the range and filters it used. |
For steps, see Review your ad program in Ad Program Insights.
Examples
| Where | What you do | What you get |
|---|---|---|
| Explorer | Add Unfilled Impressions as a measure and group by Zone Names | The Zones ranked by unfilled ad opportunities, to see where requests go unfilled. |
| Explorer | Pick a range that starts before 27 March 2026 | Ad opportunities, fill rate, unfilled impressions and estimated value gap cover only the part of the range from 27 March 2026. |
| Assistant | Ask for ad spend by Site for the last month | An answer by Site. Check it against the dashboard for the same range. |
Defaults and scope
- One network at a time. Both show the network you have open. To see another network, switch network in the Ad Server UI and open the page again.
- Hourly data. The data is aggregated by the hour, so the smallest time unit is one hour.
- Not covered here. Flight pacing is in Campaign health check up. Campaign-level reports are in custom reports.
Related
Updated 1 day ago