
Review your ad program in Ad Program Insights
Step-by-step reviews for media owners in Ad Program Insights: a leadership review, unfilled inventory, demand concentration and the AI assistant.
Ad Program Insights lets you review your whole ad program without building a report. Business managers use it to prepare leadership reviews, find unfilled inventory and watch demand concentration. This guide sets out the order to work in and the checks to make at each step. These tasks use the three areas of Ad Program Insights: the dashboard, the performance explorer and the AI assistant. Each task says which areas it uses. To catch Flights that are off pace, use Campaign health check up.
Enabled per networkAd Program Insights is enabled per network. If it is missing under Reports, contact your Kevel representative.
How it works
Work from the whole program to the detail. Open Reports > Ad Program Insights and read the three sections from top to bottom: Inventory, Revenue and Performance. When you want to slice a figure or ask a question, use the performance explorer and the AI assistant.
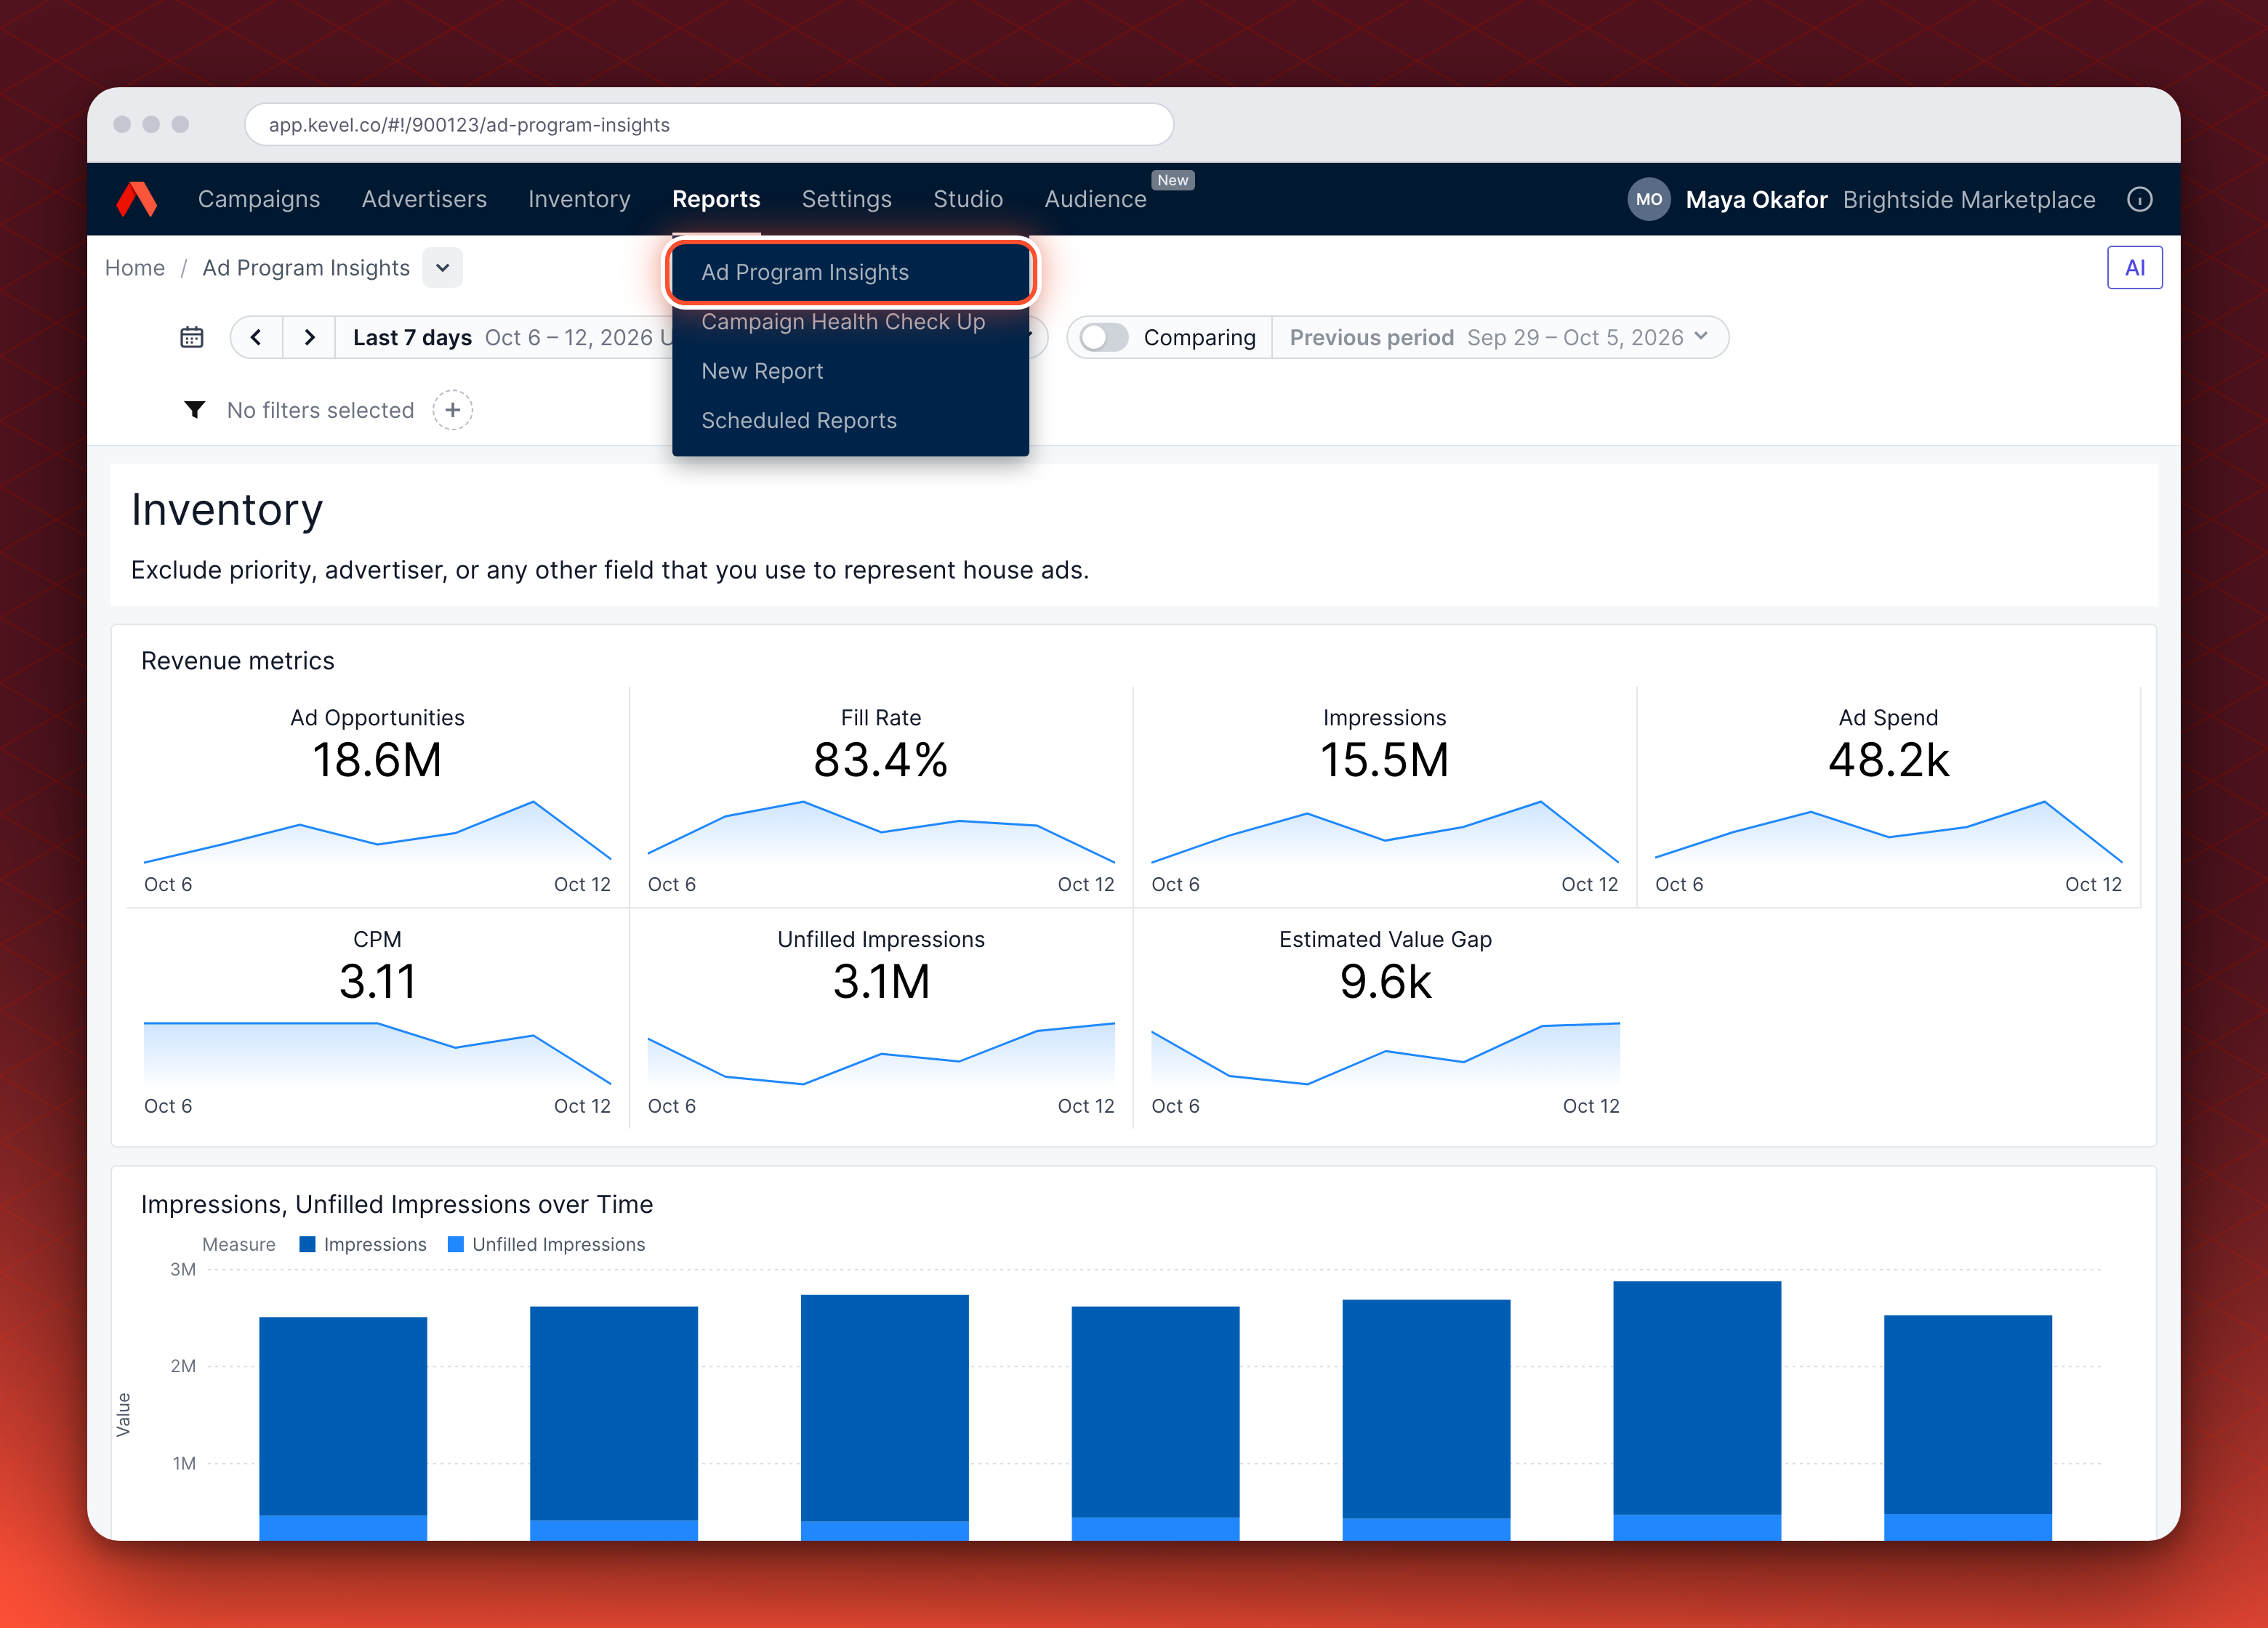
The dashboard shows the network you have open.
Before you start
Where it applies. The Ad Server UI, under Reports, for each network where Ad Program Insights is enabled.
What you need. Access to the network in the Ad Server UI. For flat-rate revenue, the start date accrual setting. Your Kevel representative changes the setting.
What it does not do. The dashboards do not edit Campaigns or Flights. To act on a finding, open the Flight under Campaigns. Ad Program Insights does not report by user or break figures down by Campaign, and it does not replace custom reports or scheduled reports.
Prepare a leadership review
Purpose. Gives you one pass over revenue, fill rate and the mix of Advertisers, so you do not stitch figures together from separate reports.
Areas used. Dashboard.
What you need to do.
- Open Ad Program Insights. Go to Reports > Ad Program Insights.
- Set the period you will present. The dashboard opens on the last 7 days. Change the time range to the period for your audience.
- Exclude house ads. Filter out the Priority, Advertiser or other field you use for house ads before you read inventory figures.
- Read the KPI tiles. In the Revenue metrics cards under Inventory and Performance, start with ad spend, CPM and fill rate, then clicks, purchases, conversion value and ROAS. Use the sparkline to show the trend and turn on Comparing for the change against the previous period. Rely on movements over weeks, not a single day, and use CTR and ROAS to explain changes in ad spend, CPM or fill rate.
- Check the mix of Advertisers. In Revenue, read each Advertiser's share of ad spend.
- Record the setup. Write the time range and filters next to each figure so others can reproduce it.
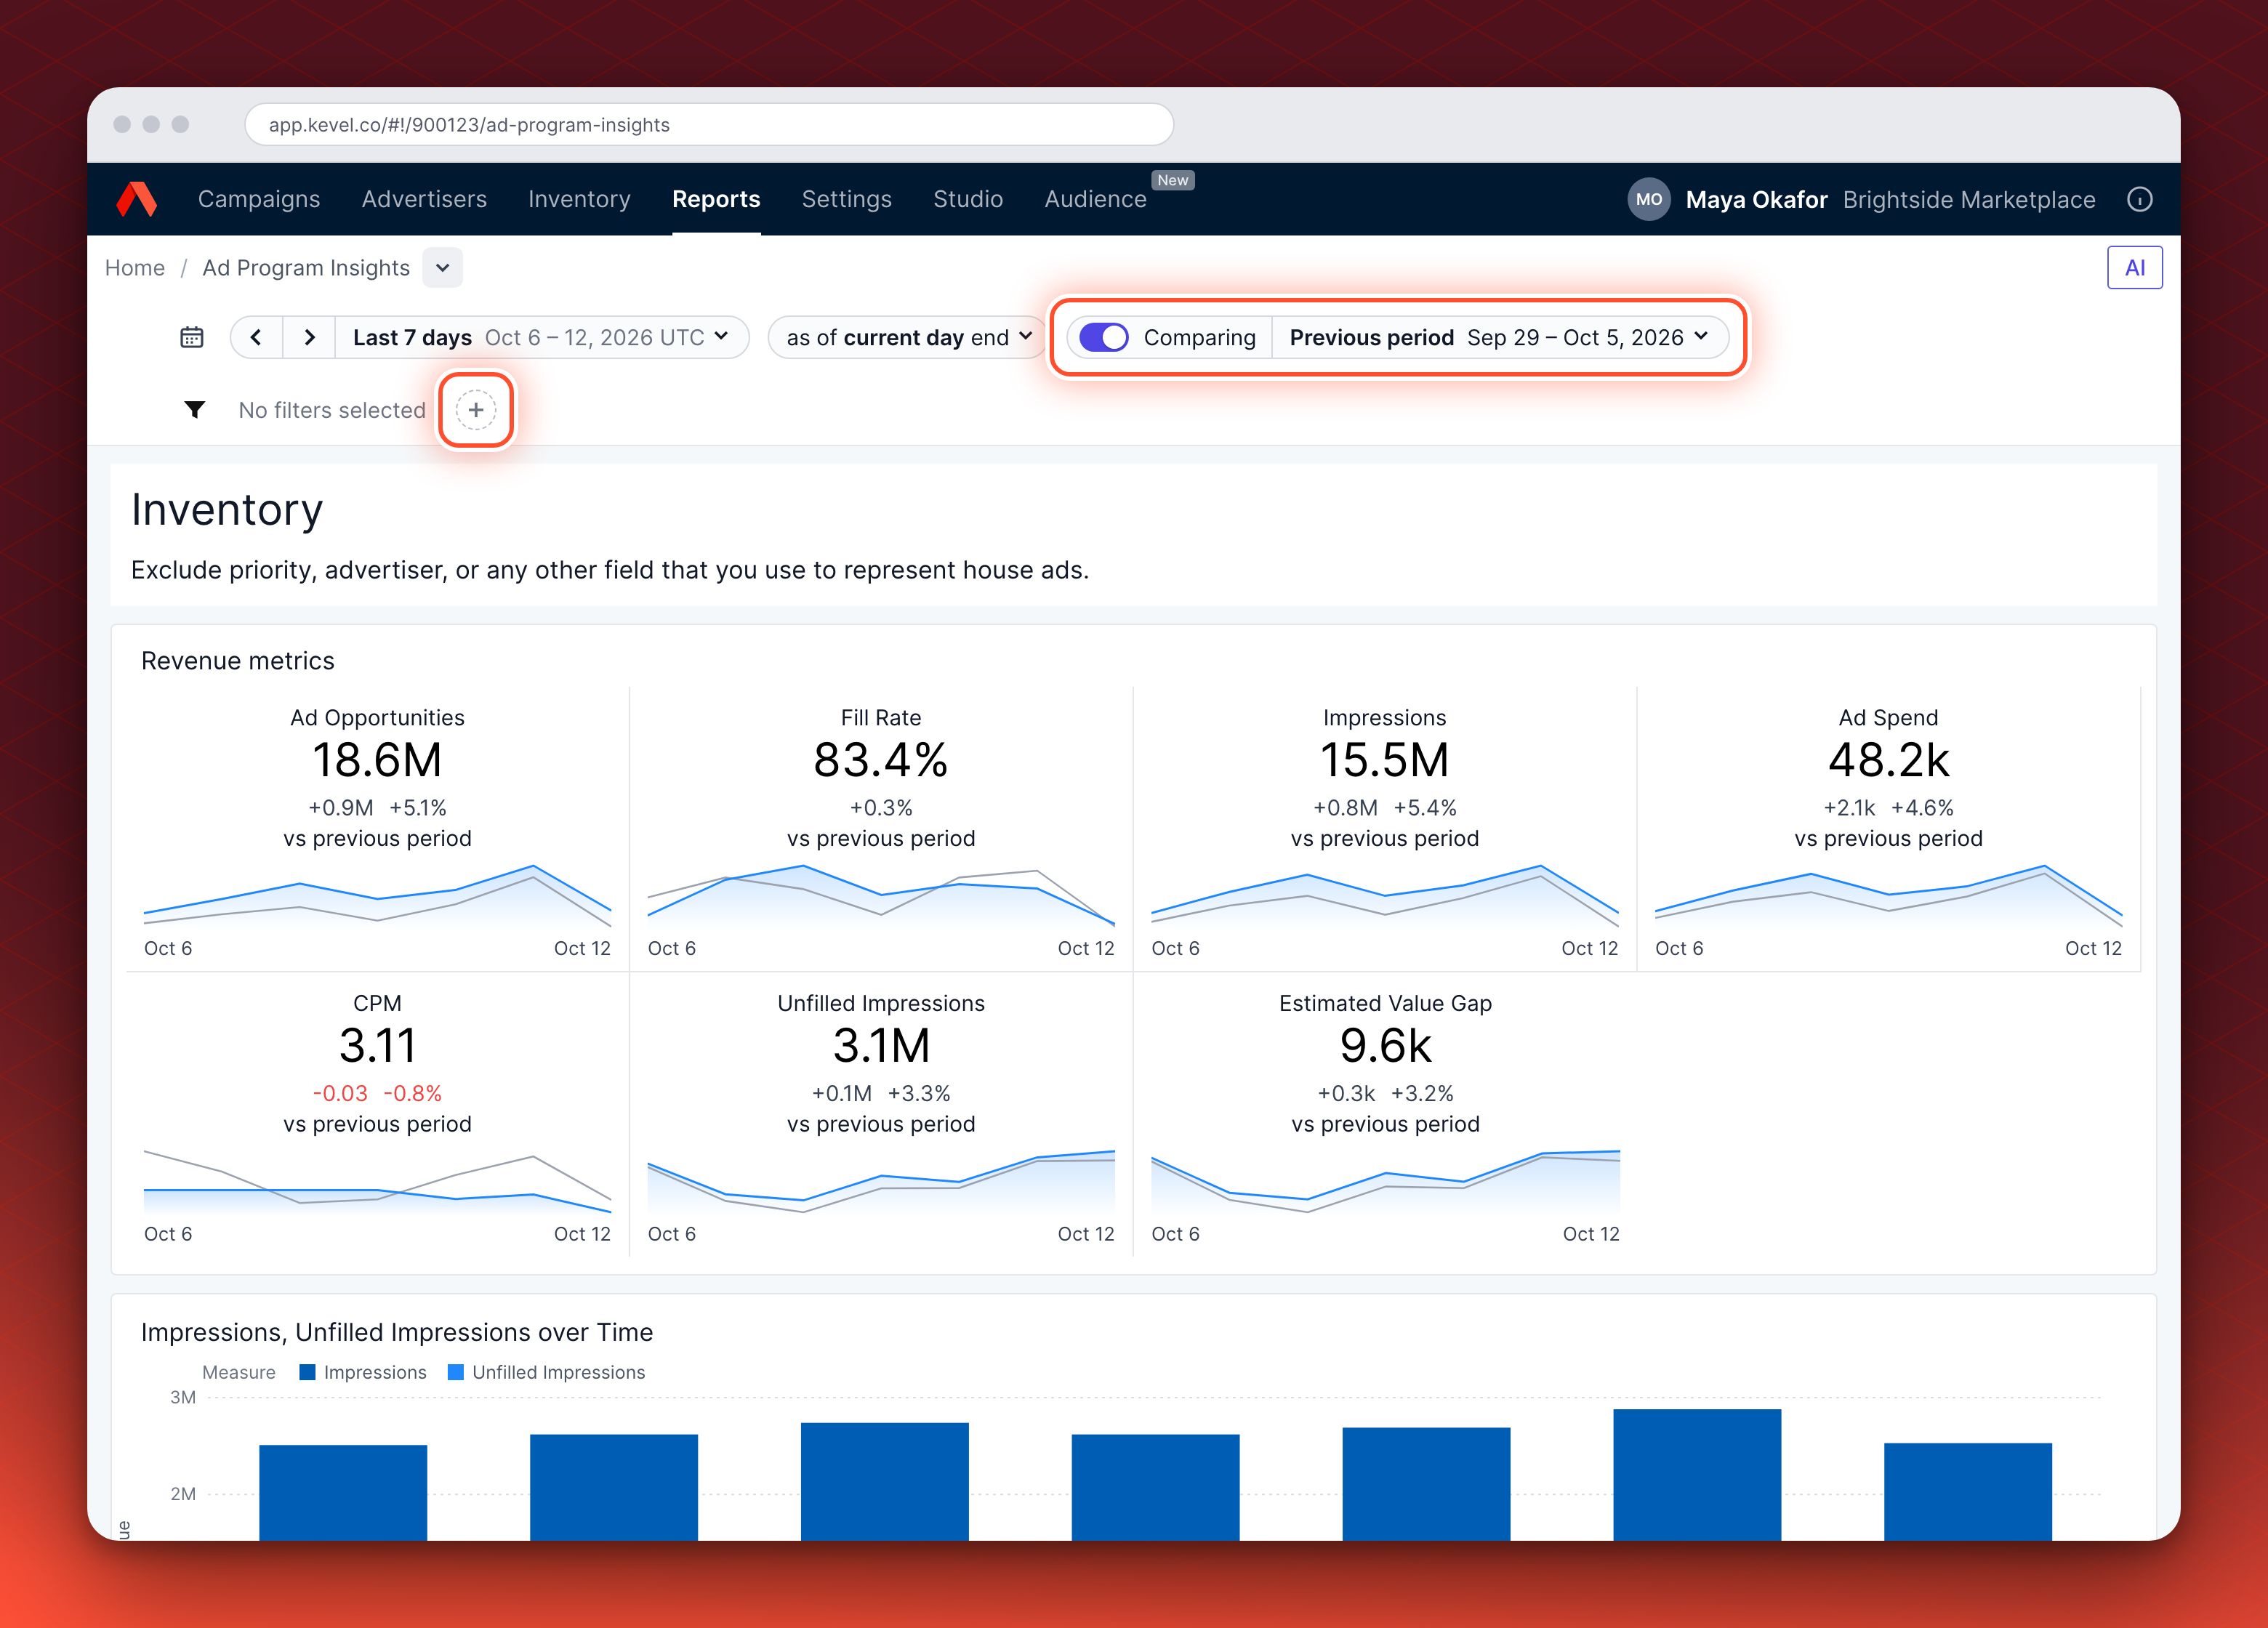
Validation. Run a custom report for the same dates and compare its Revenue column with ad spend. Ad spend includes revenue only from events with a valid user agent that are not duplicate impressions.
Common errors.
| What you see | What to do |
|---|---|
| Ad spend is lower than a report | Check the report uses the same dates, time zone, filters and grouping. A report requested through the Reporting API can also set its own flat-rate accrual method. If a like-for-like report still differs, send your Kevel representative both figures, the dates and the network ID. To compare with another platform, read Reporting discrepancies. |
| Fill rate is empty, or covers less than your range | Inventory measures start on 27 March 2026. A range before that date has no value, and a range that spans it covers only the later part. Move the start date to 27 March 2026 or later. |
Find inventory with low fill rate
Purpose. Shows where requests go unfilled, so you decide where to add demand or change placements.
Areas used. Dashboard, then the performance explorer.
Inventory measures start on 27 March 2026Ad Opportunities, Fill Rate, Unfilled Impressions and Estimated Value Gap are available from 27 March 2026. For a range that starts earlier, they cover only the part of the range from that date.
What you need to do.
- Pick a date range. Choose the period you want to review.
- Read Fill Rate & Impressions over Time and Fill Rate & Ad Opportunities over Time. Check whether fill rate falls as ad opportunities rise. That means more requests are going unfilled, and Unfilled Impressions and Estimated Value Gap show how much.
- Open the Ad Program performance explorer. Switch to Pivot. Select Zone Names, then Ad Opportunities, Fill Rate, Unfilled Impressions and Estimated Value Gap from the lists at the left.
- Sort and filter. Sort by unfilled impressions or estimated value gap, and exclude house ads.
- Shortlist. Note the Zones with many opportunities and low fill rate, then review demand and placements for them.
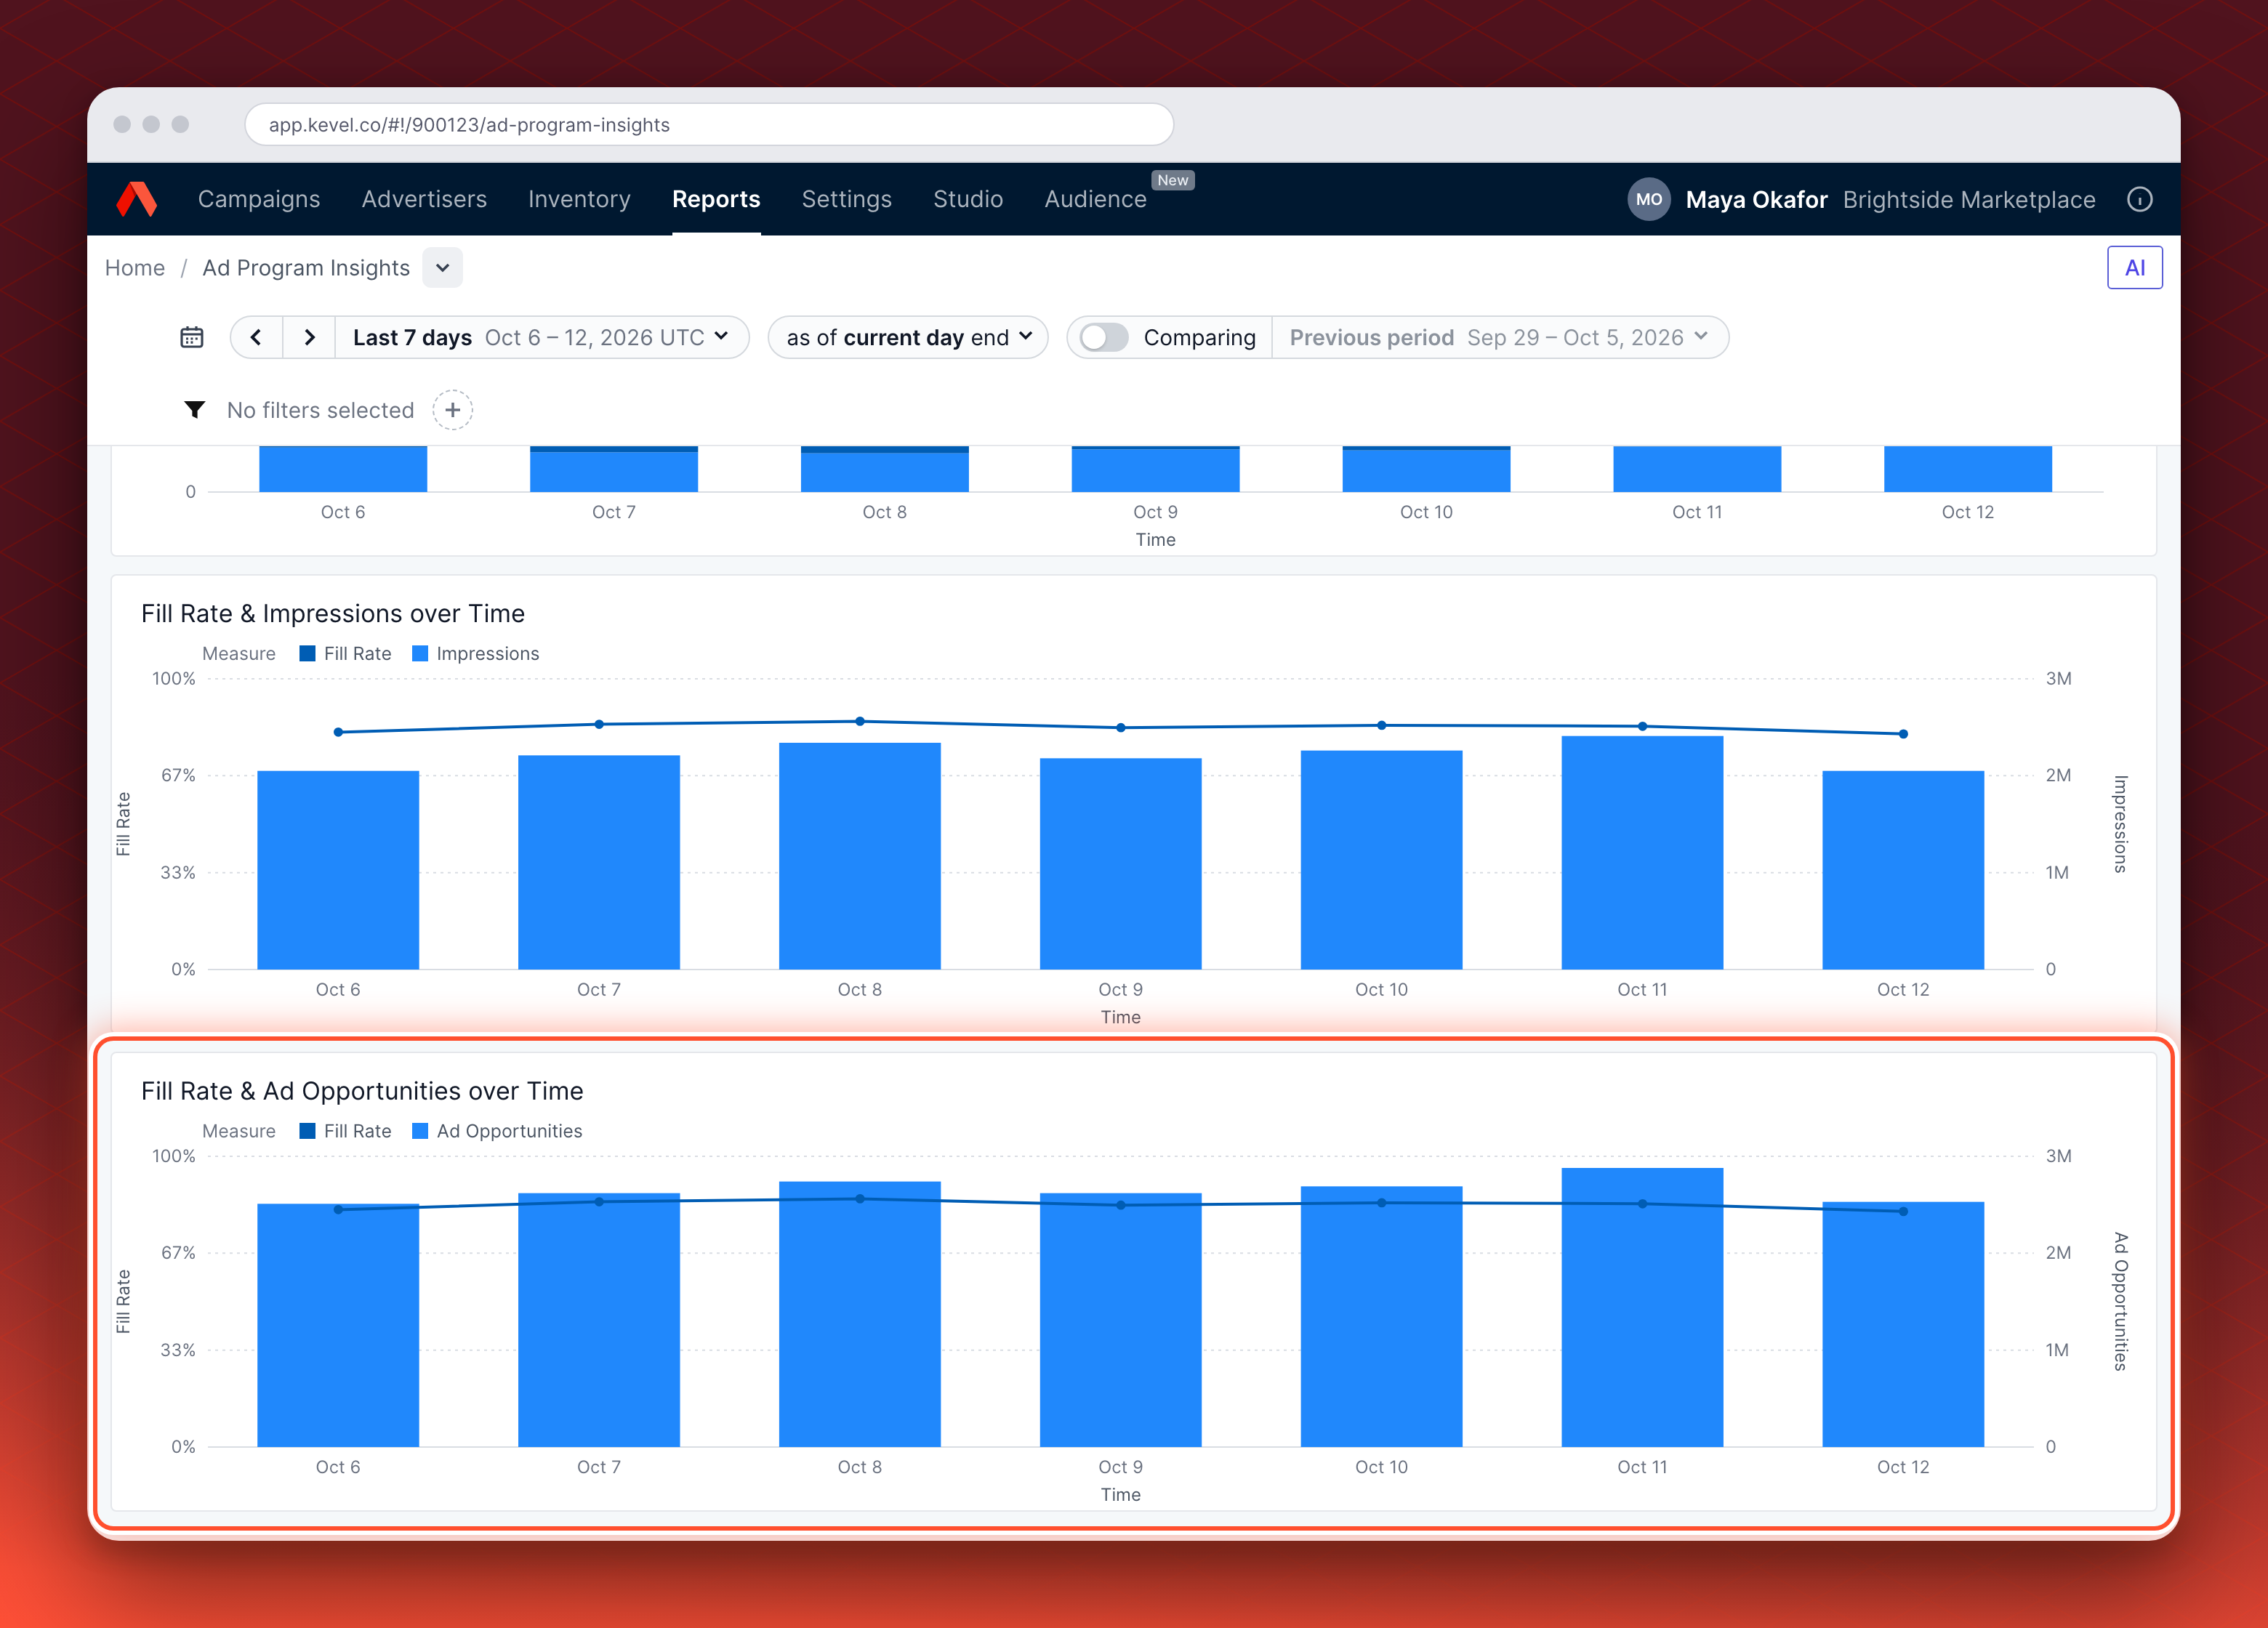
Validation. Fill rate for a slice equals its impressions divided by its ad opportunities, both counted from 27 March 2026. A slice total should be close to the KPI tile for the same range and filters.
Common errors.
| What you see | What to do |
|---|---|
A row named <unknown> | No name is on file for that ID. Send the network ID and range to your Kevel representative. |
| Fill rate looks wrong for a slice | Check the range starts on or after 27 March 2026 and that house ads are excluded. If the figure still looks wrong, contact your Kevel representative. |
Check demand concentration
Purpose. Shows whether too much revenue depends on one Advertiser, before a single departure affects the program.
Areas used. Dashboard, then the performance explorer.
What you need to do.
- Set the range. Use a period long enough to include seasonal buyers.
- Read Ad spend split by Advertiser. In Revenue, this donut shows each Advertiser's share of ad spend, with the total in the middle. One Advertiser with a large share is the concentration risk to watch.
- Read Ad spend by Advertiser and AdType Name. It is the last card in Revenue. It shows which ad types each Advertiser buys, for up to 40 Advertisers and 40 ad types.
- Count Advertisers over time. In the Ad Program performance explorer, add the # advertisers measure and compare ranges.
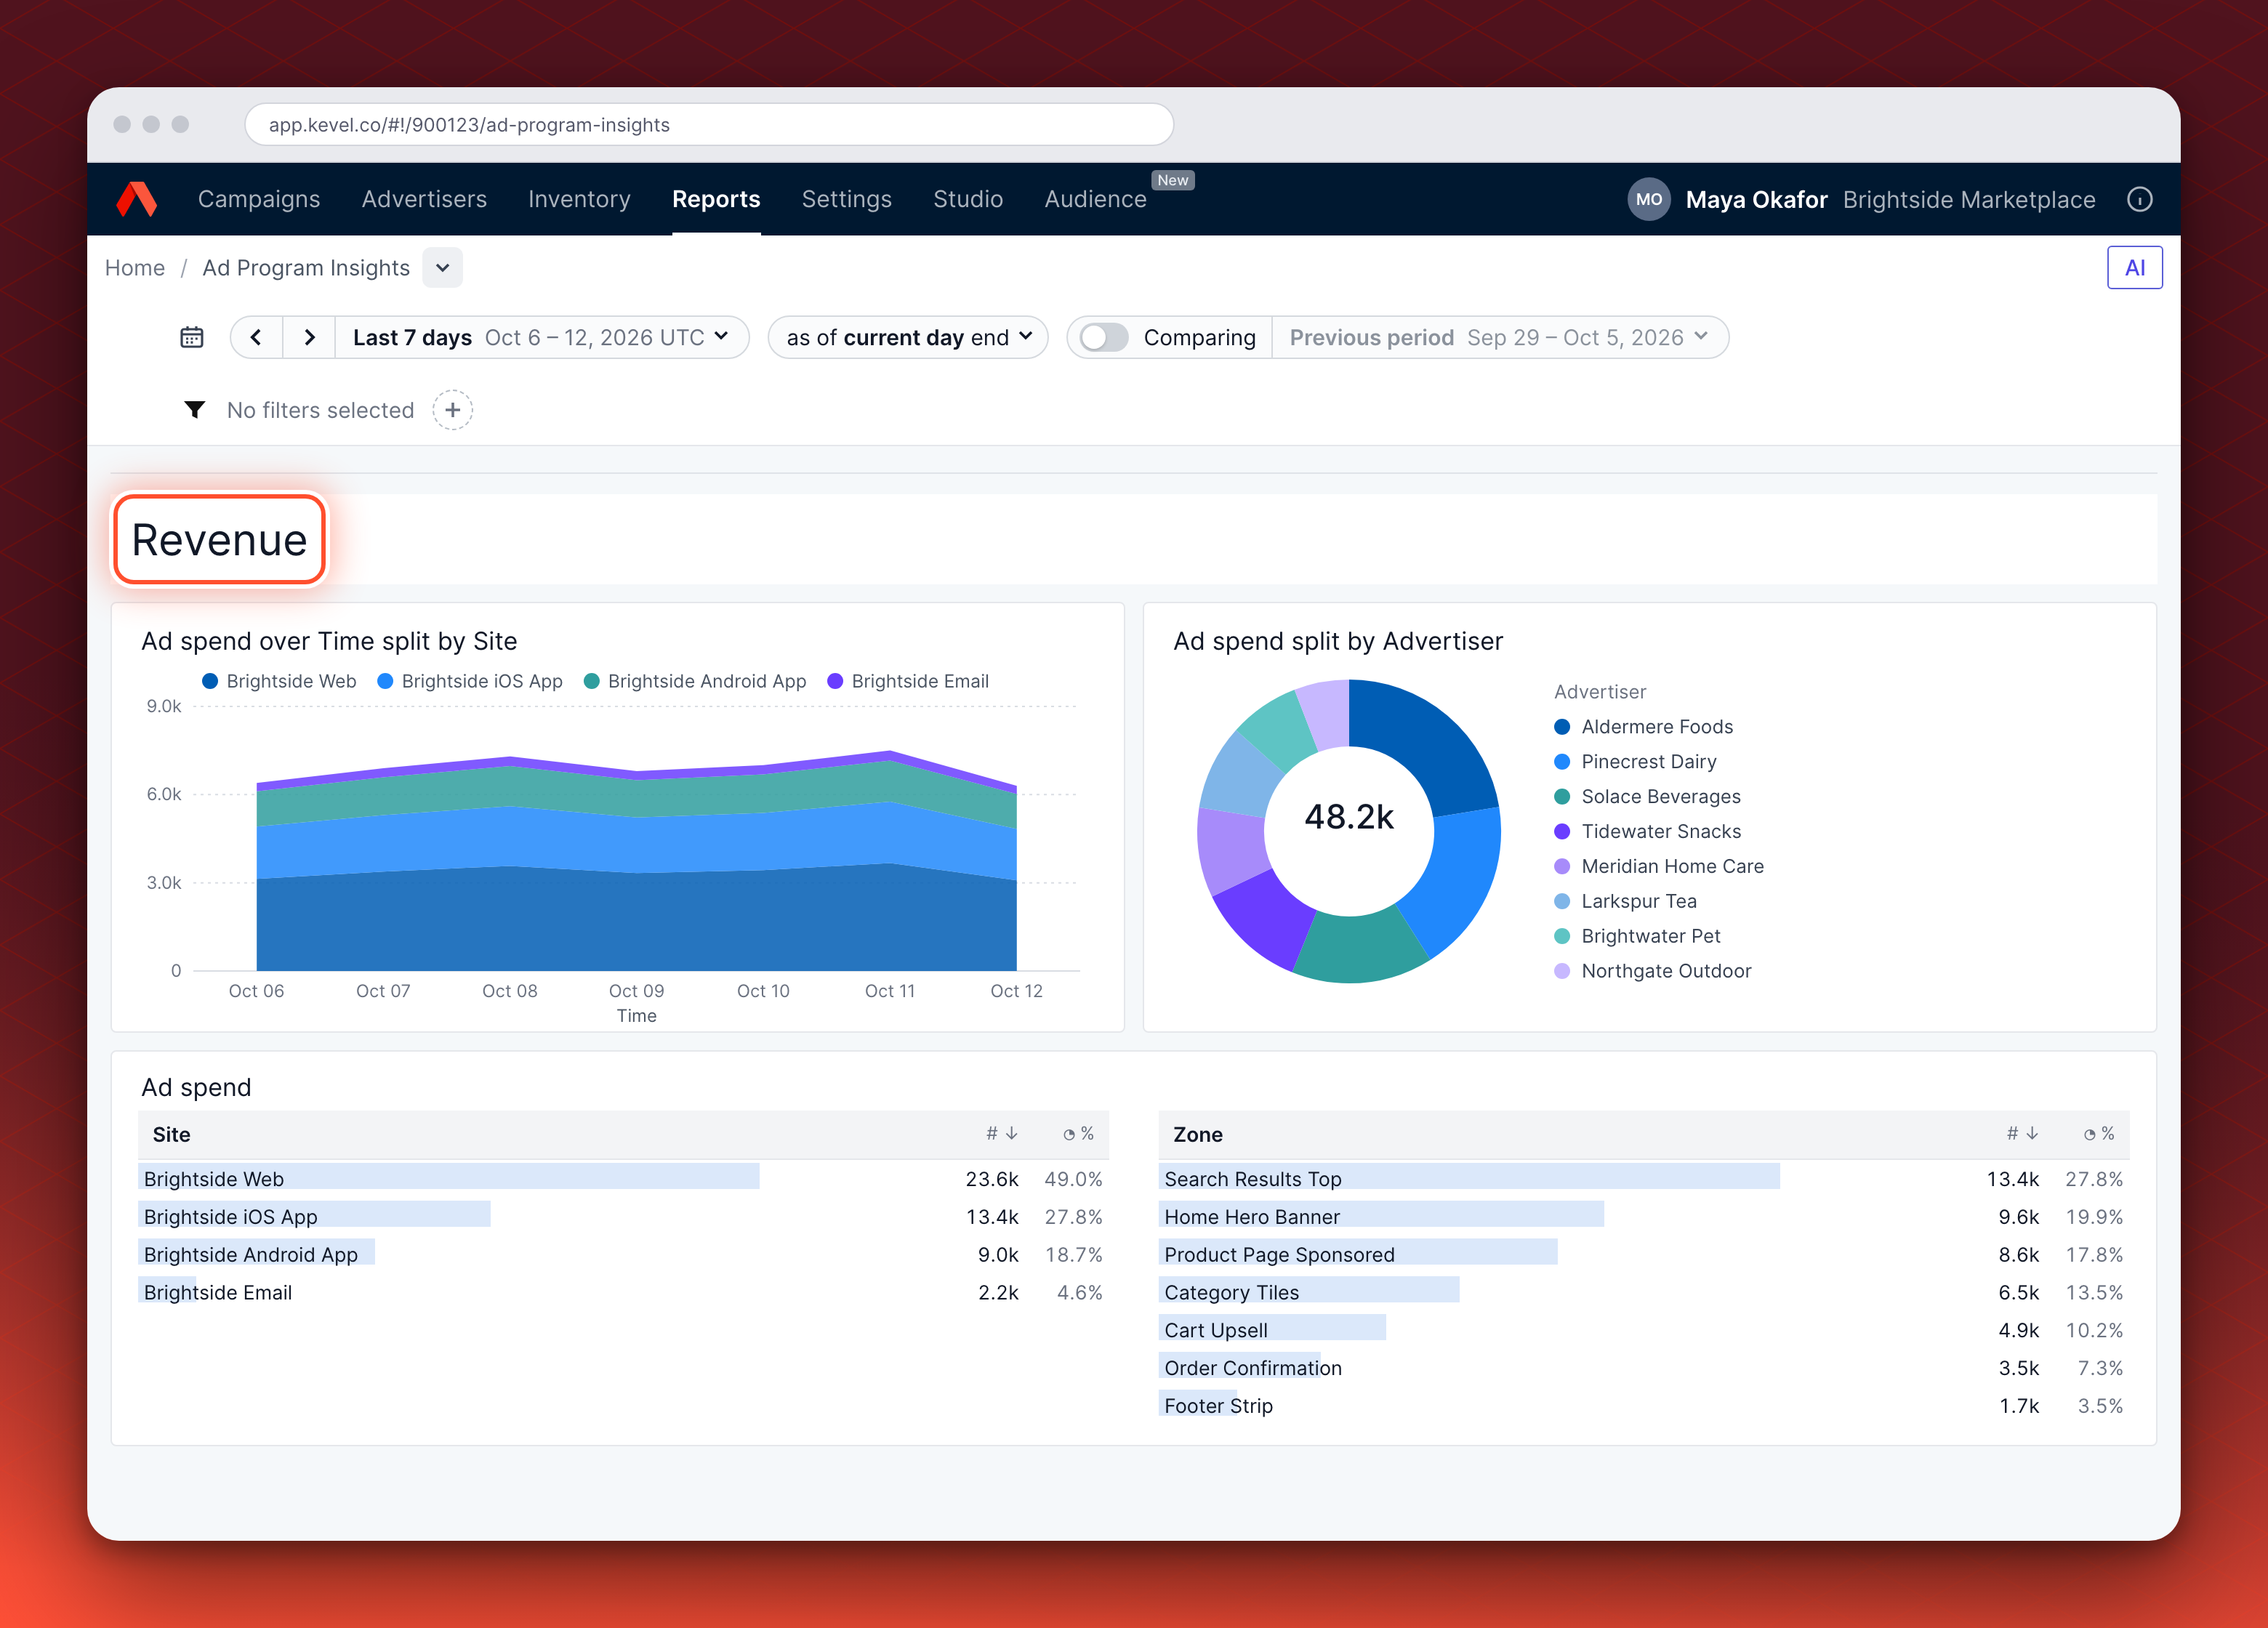
Validation. With 20 or fewer Advertisers, the shares add up to the ad spend KPI for the same range. The donut shows at most 20 Advertisers, so with more than 20 the shares cover the top 20 only.
Common errors.
| What you see | What to do |
|---|---|
| Ad spend is 0 for a flat-rate Flight | Your network may be on no accrual, the default, or your range may not include the Flight's start date, which is the day start date accrual counts its revenue. Check the range, then contact your Kevel representative. See How flat-rate revenue appears. |
Ask the AI assistant
Purpose. Gets a plain-language answer without building a view.
Areas used. AI assistant, opened from the dashboard or the explorer.
What you need to do.
- Open the assistant pane. Select AI at the top right of the dashboard.
- Ask a specific question. Name the measure, the period and the breakdown, such as ad spend by Site for the last month. For ideas, see the prompts to start with.
- Ask for the range. Ask the assistant to state the time range and filters it used.
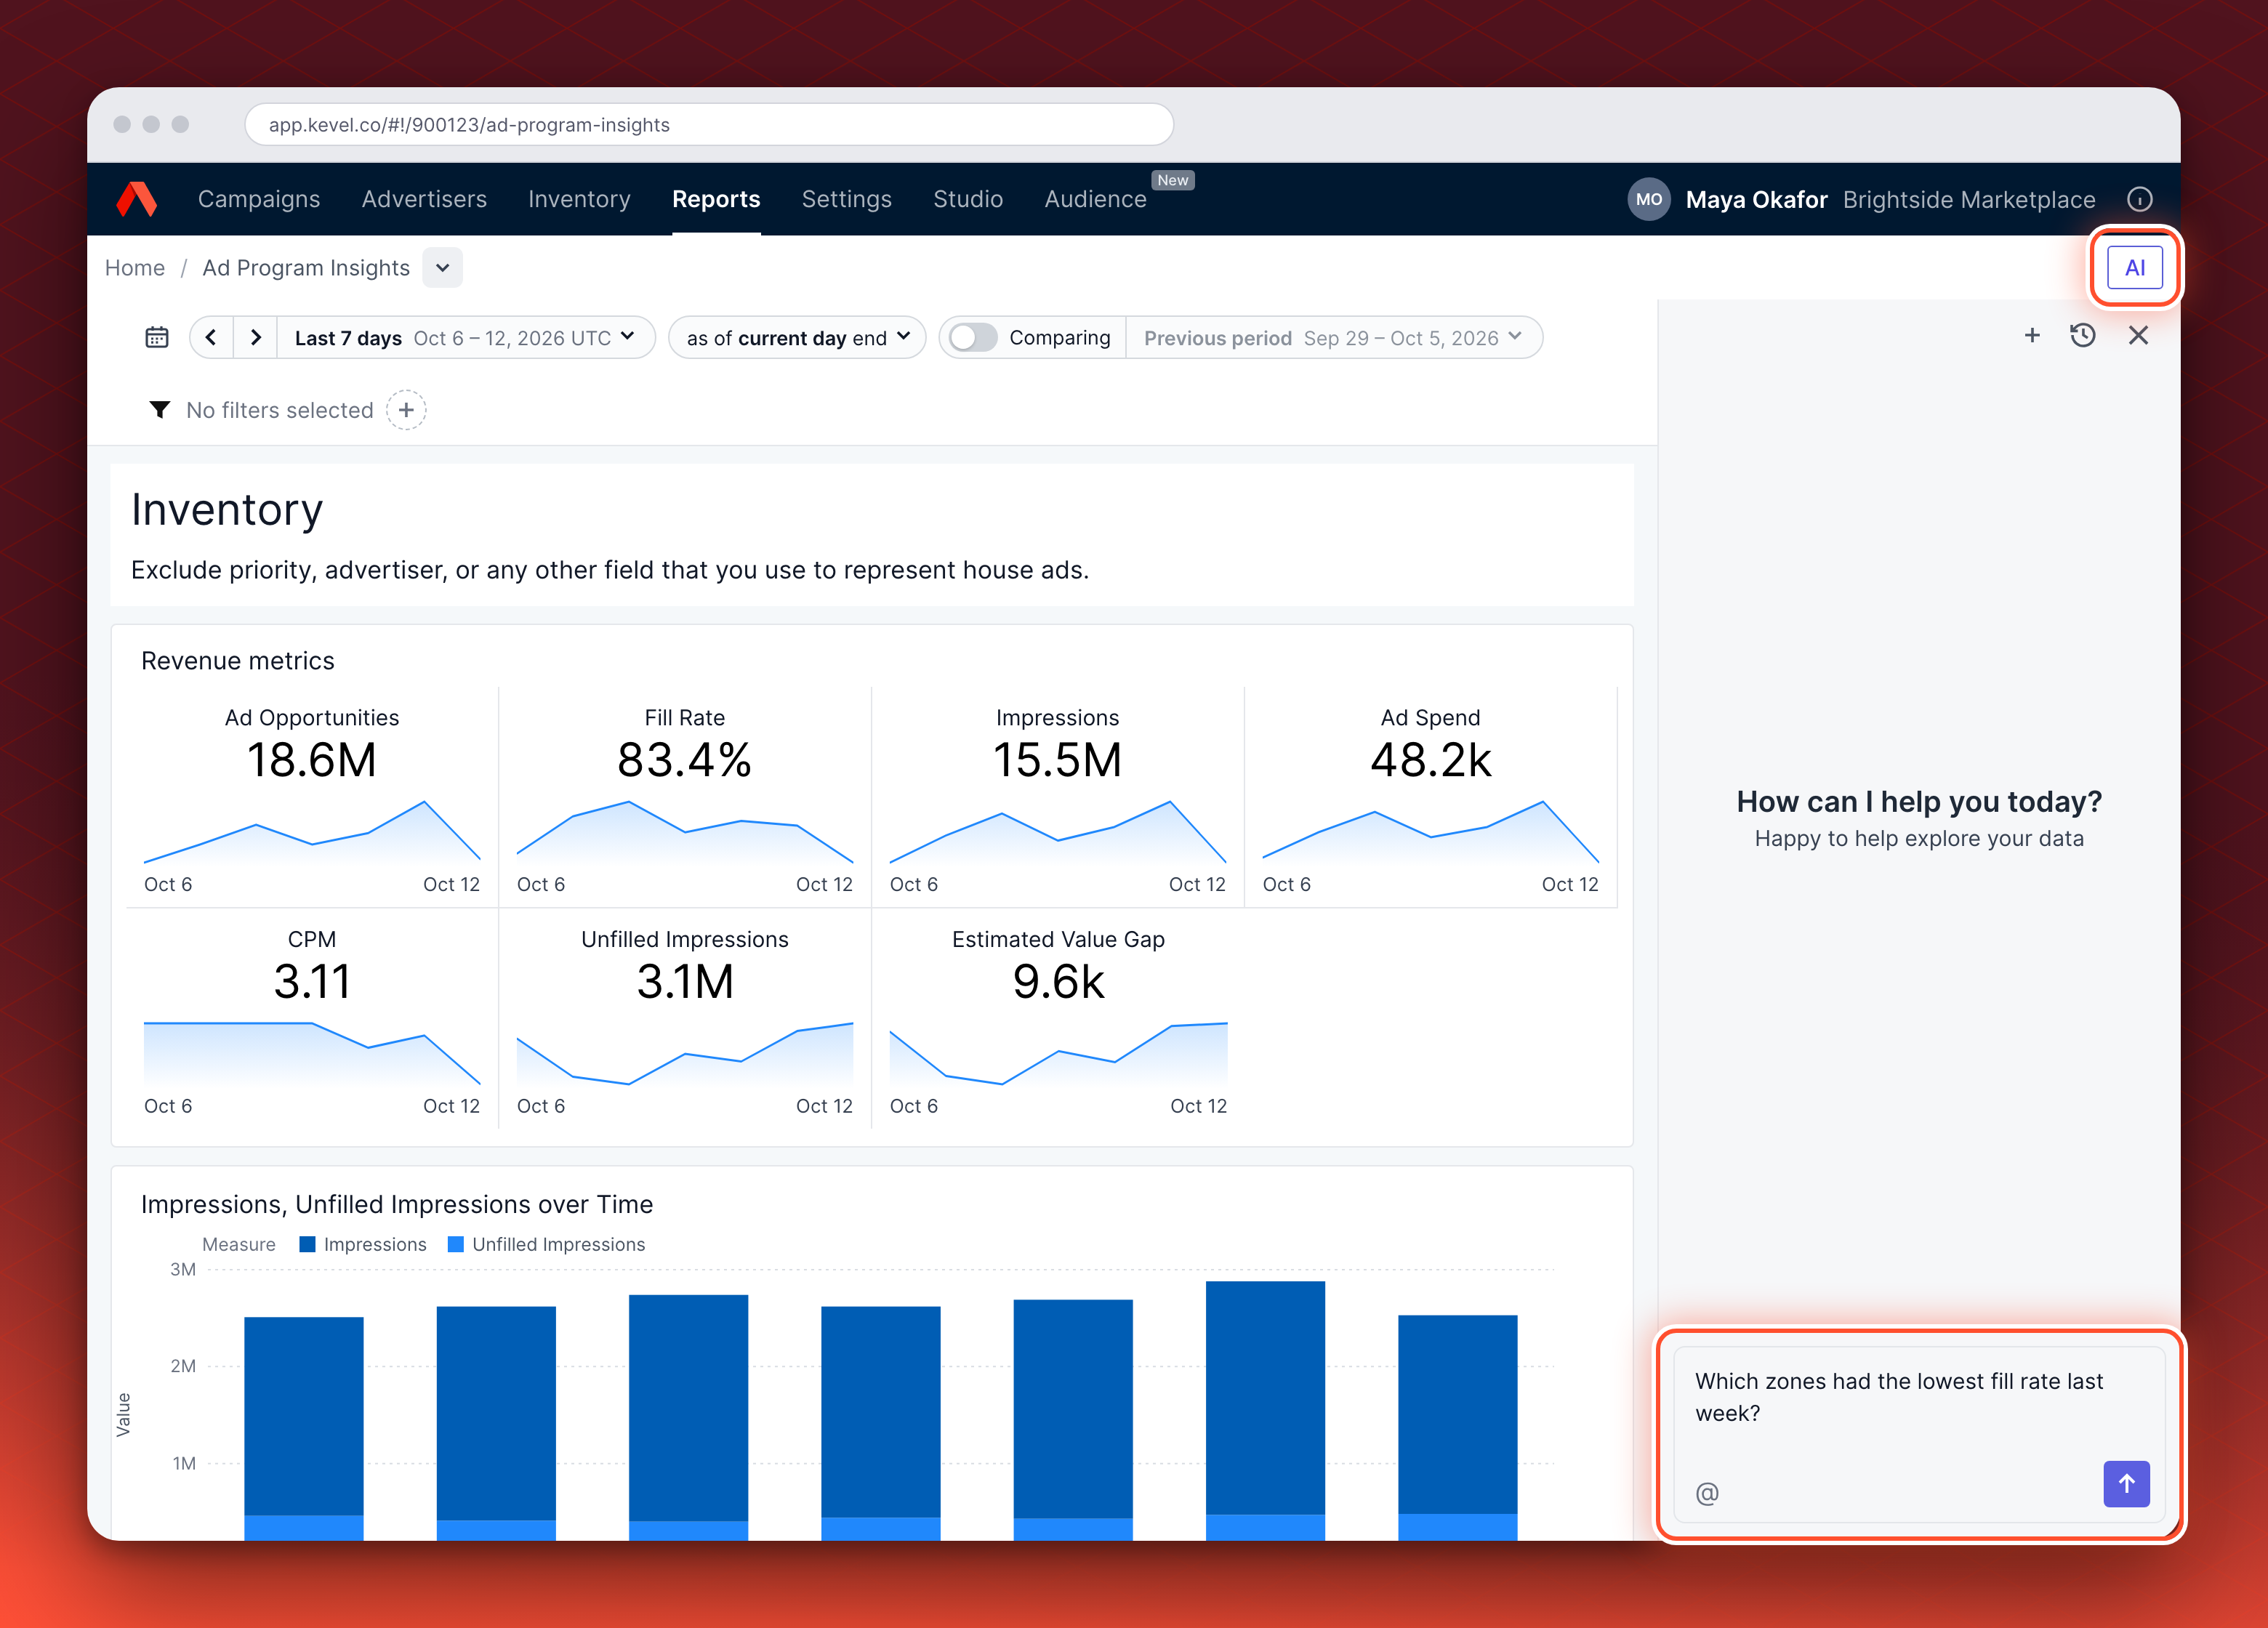
Validation. Reproduce the answer in the dashboard with the same range and filters.
Common errors.
| What you see | What to do |
|---|---|
| A reply that the information belongs to another network | Switch to that network in the Ad Server UI, then ask again. |
| An answer that differs from the dashboard | Trust the dashboard figure. Report the question and range to your Kevel representative. |
Troubleshooting
The dashboard is missing under Reports. Dashboards are enabled per network. Check you have the right network open, then contact your Kevel representative.
The page shows Error loading dashboard. The message reads "Please contact Kevel support for assistance." Reload the page once. If it persists, send Kevel support the network ID, the dashboard name and the time you saw it.
The dashboard area is blank, a spinner does not finish, or an error appears inside the dashboard. Reload the page. If it persists, contact Kevel support with the same details.
Moving around the dashboard does not change the browser address. Reloading the page returns you to the dashboard you opened from Reports.
A figure looks wrong. Check in this order. First, the time range and filters: Ad Program Insights opens on the last 7 days and the Ad Program performance explorer on the last three months of data. Second, the start date for inventory measures, which is 27 March 2026. Third, your network's flat-rate accrual setting: with no accrual, flat-rate revenue is 0, and with start date accrual it counts on the Flight's start date. Fourth, compare with a custom report for the same dates and grouping. If it still looks wrong, send your Kevel representative the network ID, the dashboard name, the time range, the filters, the figure shown and the figure you expect with its source.
Related
Updated 2 days ago